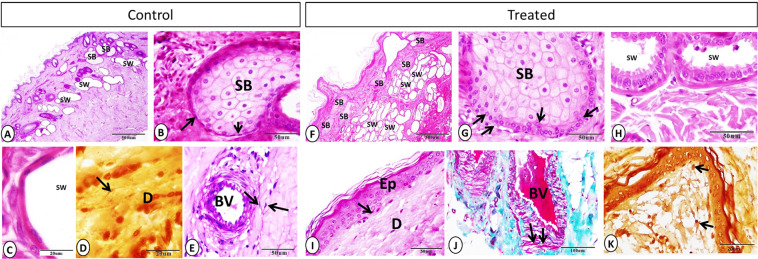
Figure 3.
Sebaceous gland, sweat gland, telocytes, and dendritic cells on control and treated groups. (A–F) Sebaceous gland (SB) showing hypertrophy and hyperplasia in treated group, and the sweat gland (SW) were more numerous in the treated group (A: PAS-Hx. F: Hx-E). (B–G) Hx-E staining showing sebaceous gland (SB) and basal cells (black arrows), which appeared larger and arranged on several layers on the treated group. (C–H) Hx-E staining showing sweet gland (SW) with well-developed secretory activity in melatonin group in compared with control one. (D-E-I-J) Telocytes (black arrows), blood vessel (BV), epidermis (Ep) and dermis (D). (D) Grimelius silver nitrate method. (E) PAS-Hx. (I) Hx-E. (J) Crossmon’s trichrome staining). (K) Grimelius silver nitrate method showing dendritic cell on dermis of treated group (black arrows).

