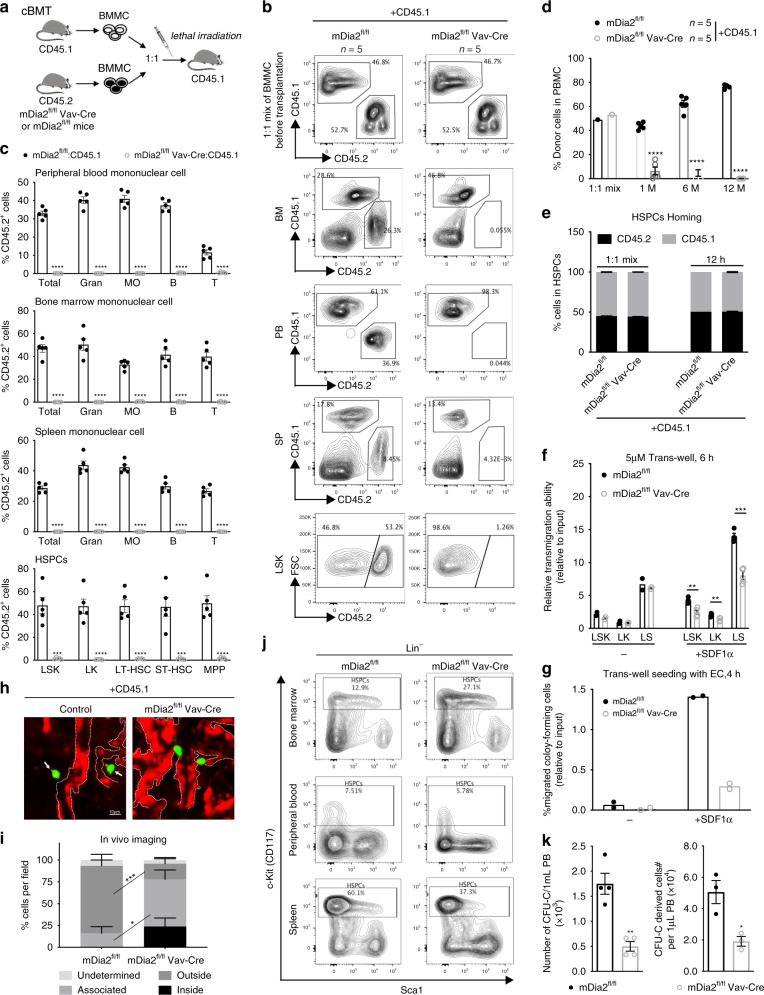
Fig. 2. Defects in competitive engraftment in mDia2-deficient HSPC.
a Schematic illustration of competitive bone marrow transplantation. b Chimerism studies in indicated tissues and bone marrow LSK cells. Representative flow cytometric plots illustrate the percentages of wild type competitive BMMCs (CD45.1+) and the control or mDia2fl/fl Vav-Cre BMMCs (CD45.2+) before and 1.5-month after transplantation. c Quantitative analyses of the percentage of donor cells in b. Gran: Gr1+ Mac1+ granulocytes; MO: Gr1-Mac1+ monocytes; B: B220+ B cells; T: CD3e+ T cells. d Peripheral blood chimerism analyses at the indicated time points. b–d n = 5 mice per group. e mDia2fl/fl or mDia2fl/fl Vav-Cre bone marrow lineage negative (CD45.2+) HSPCs (2 × 10⁷ cells) were mixed with equal wild-type CD45.1+ competitive lineage negative cells and transplanted into lethally irradiated wild type mice. Bone marrow chimerism studies were performed at 12 h post-transplantation. Representative data are shown and similar results were repeated twice. f Transwell migration assay of HSPCs in the presence or absence of SDF-1α. n = 2 mice in no serum group, n = 4 mice in SDF1a group. g Transwell migration assay of indicated lineage-negative cells in the presence of mouse endothelial cells (EC) with or without SDF-1α. n = 2 mice per group. h In vivo imaging of fluorescently labeled lineage negative donor cells from the femur of wild-type mice 18 h after competitive transplantation with an equal number (9 × 10⁵) of non-fluorescently labeled CD45.1+ cells. Red, CD31+ endothelial cells. Green, CD45.2+ donor cells. Dashed white lines outline blood vessels. Repeated twice with similar results. i Positions of the indicated donor cells relative to the outlined CD31+ lining sinusoids or arteries were quantified in five fields. N = 39 in mDia2fl/fl group. N = 18 in mDia2fl/fl Vav-Cre group. j Representative flow cytometric plots showing percentage of c-Kit+ HSCPs among lineage negative cells after intra-peritoneal injection of G-CSF. k Colony forming assay of peripheral blood in j (n = 4 mice per group). Colony-derived cells were quantified on the right (n = 3 mice per group). Error bars represent the SEM of the mean. *p < 0.05, **p < 0.01, ***p < 0.001, ****p < 0.0001. Two-tailed unpaired Student’s t test was used to generate the p values.

