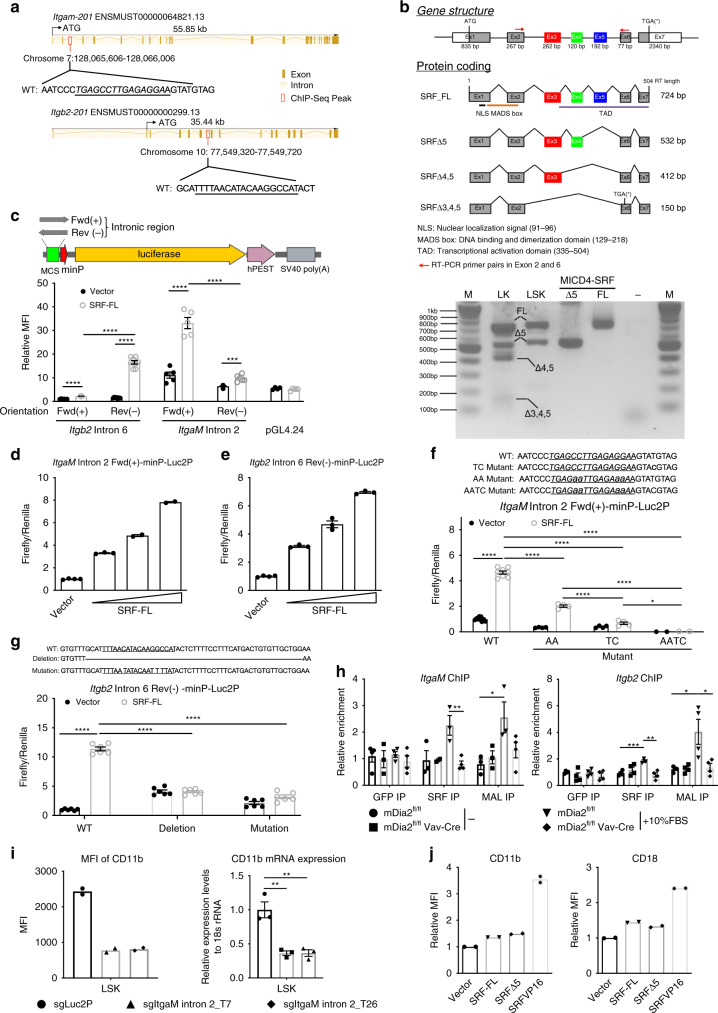
Fig. 4. Members of beta2 subfamily integrin are targets of SRF.
a Schematic map of SRF ChIP-seq peak in the genomic regions of mouse ItgαM and Itgb2. Putative SREs are underlined. b Full-length and variants of SRF in murine hematopoietic cells (upper panel). SRF variants were amplified by conventional RT-PCR from the indicated cells or constructs and assessed by gel electrophoresis (lower panel). The experiments were repeated three times with similar results. c SRF enhancement of luciferase activities in reporter constructs harboring the intronic regions of Itgb2 or ItgαM is orientation dependent. 293T cells transiently expressing the indicated luciferase reporters were co-transfected with empty vectors or an SRF-FL-expressing construct in the presence of a Renilla luciferase expression vector (pRL-TK). Firefly and Renilla luciferase activities were measured after 24 h. d Up-regulation of luciferase gene expression driven by ItgaM intronic sequence with increased expression of SRF-FL in 293T cells. e Same as d except Itgb2 intronic region was tested. f The same luciferase activity assays as in c were performed using 293T cells co-transfected with either the control vector or SRF-FL plus luciferase reporters containing either intact (WT) or mutated SRE (Mutant). WT: n = 9 with vector, n = 8 with SRF-FL, AA and TC: n = 4, AATC: n = 2. g Same luciferase assays as f except Itgb2 mutants were tested. n = 6 in each group. h Chromatin immunoprecipitation assays with indicated antibodies in untreated or 10% FBS-stimulated c-Kit+ HSPCs from indicated mice. DNA fragments containing the SREs of ItgaM (left) and Itgb2 (right) were amplified and detected by real-time PCR in quadruplicate. Data are shown as the quantitation of signal relative to input chromatin. i Quantitative analyses of CD11b protein (left, n = 2 mice per group) and mRNA (right, triplicate) expressions in LSK cells from Cas9-GFP transgenic mice transduced with indicated sgRNAs. j Quantitative analyses of surface expression of CD11b and CD18 detected by flow cytometry in wild-type c-kit+ HSPCs transduced with indicated genes. n = 2 mice per group. Error bars represent the SEM of the mean. *p < 0.05, **p < 0.01, ***p < 0.001, ****p < 0.0001. Two-tailed unpaired Student’s t test was used to generate the p values.

