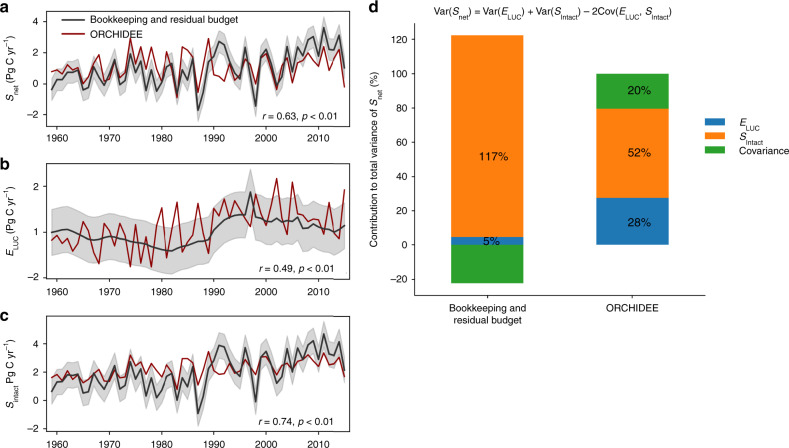
Fig. 6. Attribution of Snet and its variance into ELUC and SIntact.
a Snet. b ELUC. c SIntact. Data were shown for 1959–2015. The red line indicates ORCHIDEE result; the black line shows the result, following the bookkeeping and residual budget approach (i.e., IPCC AR5 and ref. 14), with shaded gray areas indicating the uncertainty of one standard deviation. Pearson correlation coefficients (r) between the two estimates are shown, with the period of 1991–1993 under strong Pinatubo influence being excluded when calculating r (n = 54, p-value calculated as a two-sided p-value). d shows the decomposition of temporal variances (Var) of Snet into the variances of ELUC, SIntact, and their covariance (n = 57, Eq. (5) in “Methods” section).

