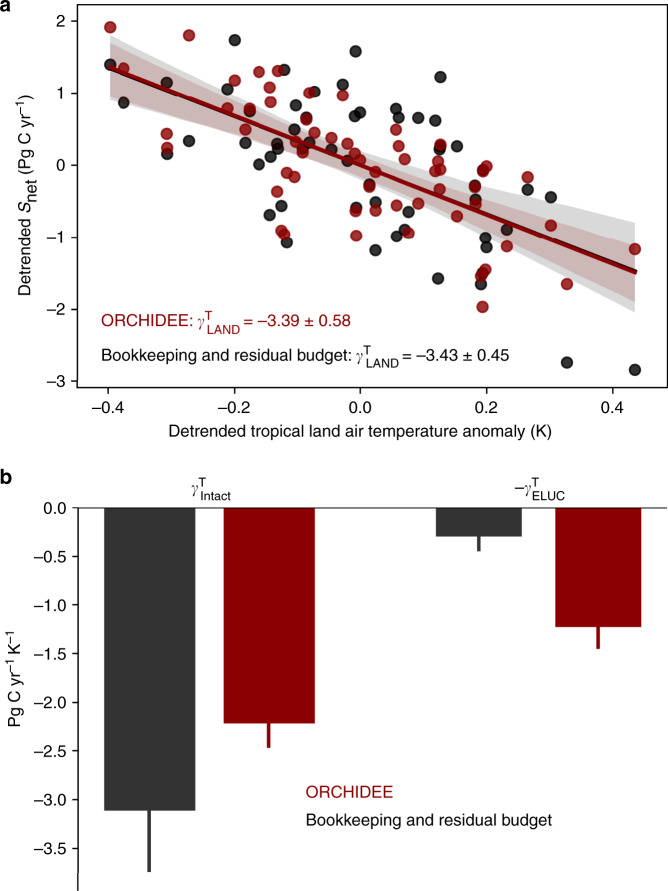
Fig. 7. Temperature sensitivity (γ) of Snet, SIntact, and ELUC.
Red color indicates results from ORCHIDEE. Black color indicates results for the bookkeeping and residual budget approach (i.e., IPCC AR5 and ref. 14). a The temperature sensitivities of Snet (). b The decomposition of into and , following the equation “Snet = SIntact − ELUC”. Negative values of and mean that elevated tropical land warming leads to less land carbon uptake, while positive values of mean that warming leads to enhanced carbon emissions from managed land (note that is shown in the figure). All linear regressions were significant with a p < 0.05 (n = 57, two-sided p-value). Shaded area in subplot a indicates the 95% confidence interval of fitted values. Error bars in subplot b indicate the standard error of fitted γ values.

