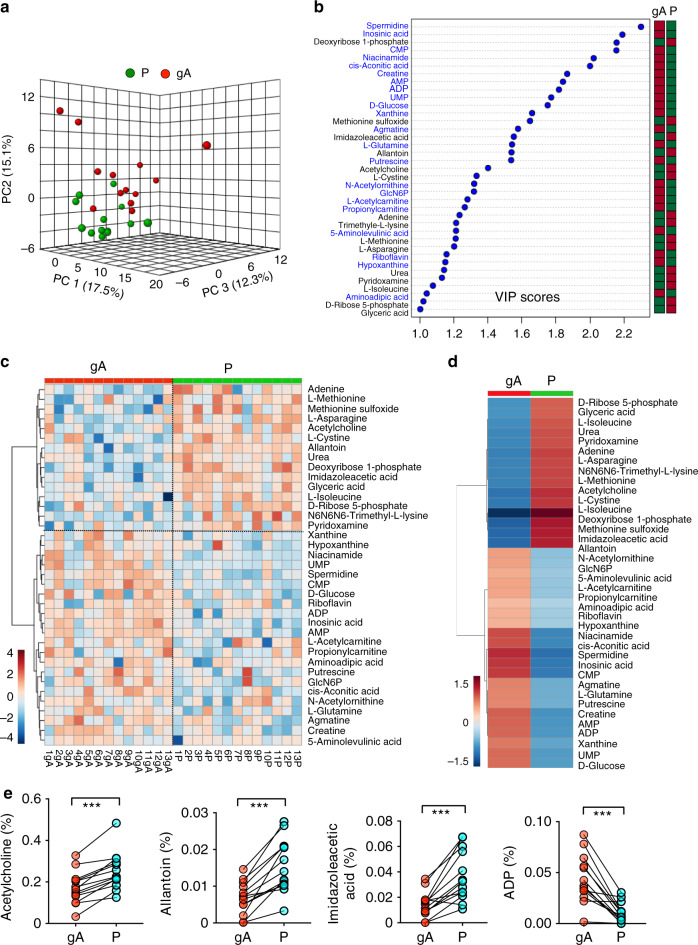
Fig. 3. Paired comparison of metabolomes from glioma artery and dorsal pedal vein plasma.
a PCA of the metabolomes of glioma artery (gA) and dorsal pedal vein (P) samples from 13 patients. Three PCs explain 44.9% (15.1%, 17.5%, and 12.3%) of variance between gA and P. PC scores are indicated as %; circles indicate individual samples from the glioma artery and dorsal pedal vein. b VIP scores of metabolites between glioma artery(gA) and dorsal pedal vein (P) plasma samples. The names of the metabolites enriched in glioma arterial blood (gA) are labeled with blue text. The columns to the right indicate whether the abundance of each metabolite is enhanced (red box) or reduced (green box) in each plasma group. c Heatmap representation of 37 of 107 metabolites of blood plasma from glioma artery (gA) and dorsal pedal vein (P) samples. Warm color indicates higher concentration. d A heatmap representation of 37 metabolites (VIP score > 1) in blood samples from glioma artery (gA) and dorsal pedal vein (P). All metabolites are listed on the right side of the map. Color bar (bottom left), warm color indicates higher concenration. e Relative abundance (normalized by TIC, y-axis) of four representative metabolites (Acetylcholine, Allantoin, Imidazoleacetic acid, ADP) from glioma artery (gA) and dorsal pedal vein (P) samples. ***p < 0.001; two-tailed paired t-test. GlcN6P, Glucosamine 6-phosphate. CMP, Cytidine monophosphate. AMP, Adenosine monophosphate. ADP, Adenosine diphosphate.

