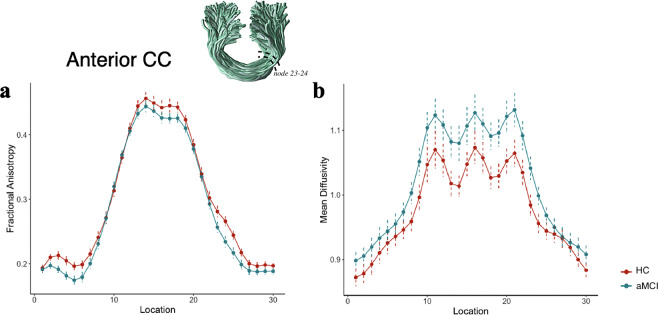
Figure 2.
Tract profiles between the 1st and 30th nodes in aMCI and HC for the anterior CC (a,b). Solid lines represent group averages for FA and MD across subjects, and dotted lines denote standard error of the mean. Tract rendering is shown for an example subject. The middle 66% (nodes 7–24) of each tract was included in the statistical analysis to avoid partial volume effect that occurs at the end points of the tract. The anterior CC showed a decrease in FA along the nodes 23–24 and an increase in MD along the nodes 18–20 and 23–24 in aMCI compared to HC (FDR-corrected, p < 0.05).

