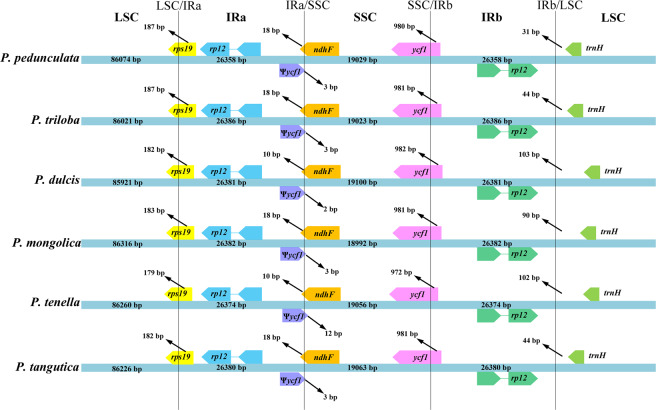
Figure 2.
Comparisons of the borders of the large single-copy (LSC), small single-copy (SSC), and inverted repeat (IR) regions among the P. pedunculata, P. triloba, P. mongolica, P. tenella, P. tangutica, and P. dulcis chloroplast genomes. The colored boxes above and below the main line indicate the adjacent border genes, where yellow indicates rps19, blue indicates rpl2, purple indicates Ѱycf1 (Ѱ indicates a pseudogene), brown indicates ndhF, pink indicates ycf1, green indicates rpl2, and light green indicates trnH.

