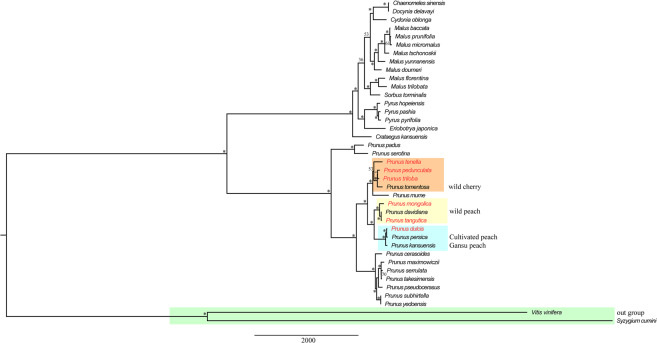
Figure 6.
Phylogenetic relationships of 39 species inferred from maximum likelihood (ML) analysis based on the complete chloroplast genome sequences. The numbers above the nodes are the support values with maximum likelihood (ML) analyses, and the symbol * indicates that the support rate of the branch is 100%. Clade I (orange): P. tenella, P. pedunculata, P. triloba and P. tomentosa; clade II (yellow): P. mongolica, P. tangutica and P. davidiana; clade III (light blue): P. dulcis, P. persica and P. kansuensis.

