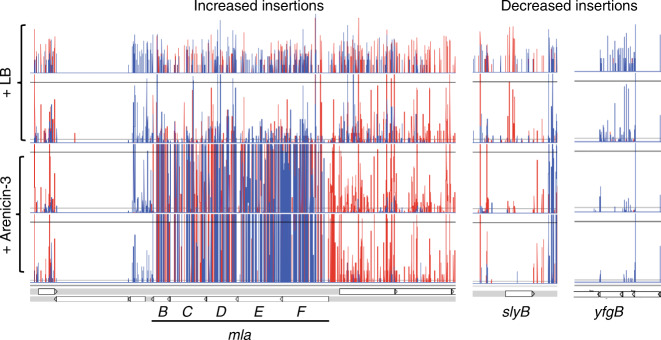
Fig. 4. TraDIS reads representing transposon insertions across themlaoperon (B-F), slyBandyfgBin UPEC.
The arenicin-3-treated library is represented by the bottom two rows and the controls with LB only, the top two rows. Insertion positions of Tn5 mutations at each bp are represented by vertical lines, the depth represented by the height of the line and the direction of insertion, the color (forward and reverse are red and blue, respectively) across the entire mla operon. Note, mlaA is not shown here as it is located separately but also displayed the same pattern of insertions.

