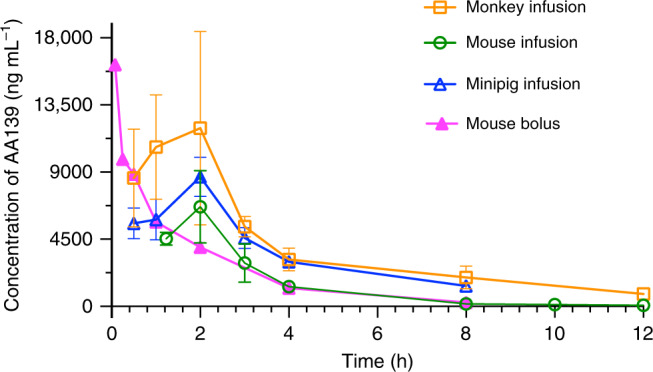
Fig. 6. The pharmacokinetic profile across species of systemically administered AA139.

Plasma or serum AA139 concentration in mouse, monkey and minipig over time after the initiation of a 10 mg kg−1 dose (i.v. continuous infusion over 2 h, or i.v. single bolus injection). Mean values with error bars shown as SEM (mouse i.v. infusion n = 6, mouse i.v. bolus n = 3, monkey n = 2, minipig n = 2; male and female combined for all species) are plotted using Prism 8. Source data are provided as a source data file.
