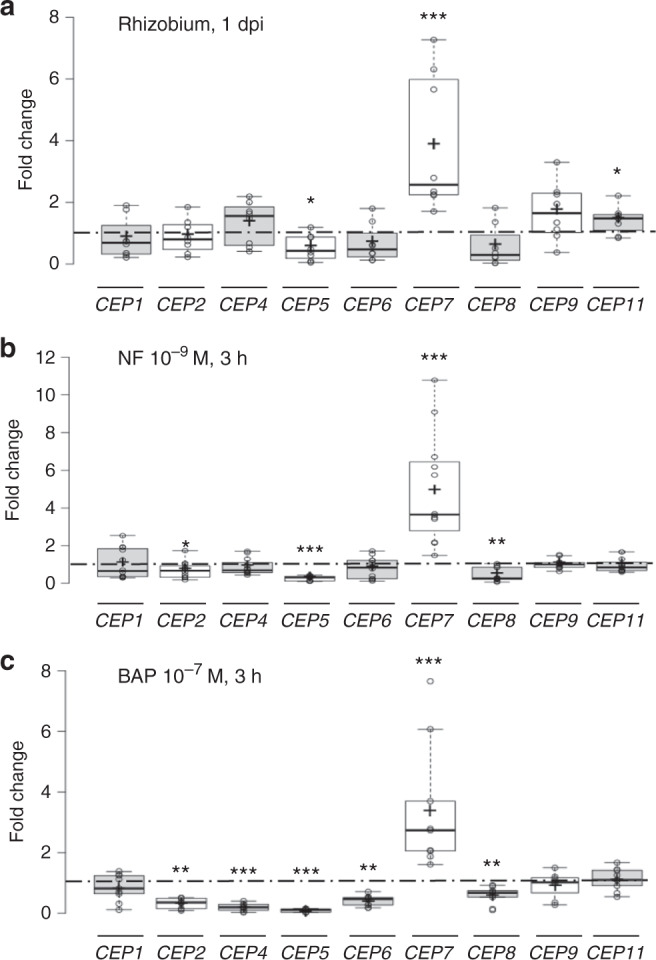
Fig. 1. Expression of CEP peptide-encoding genes in response to rhizobia, Nod factors, or cytokinins.

a Expression analysis of CEP genes in wild-type (WT) roots 1 day post rhizobial inoculation (1 dpi). qRT-PCR was used to measure the CEP gene expression levels, normalized relative to uninoculated roots. To highlight fold changes, the dotted line corresponds to a ratio of 1. Data points from four biological replicates are plotted as open circles (n = 8). b Expression analysis of CEP genes in WT roots in response to a Nod factor (NF) 10−9 M treatment for 3 h. qRT-PCR was used to measure the CEP expression levels in treated roots. The results were normalized relative to untreated roots. To highlight fold changes, the dotted line corresponds to a ratio of 1. Data points from six biological replicates are plotted as open circles (n ≥ 11). c Expression analysis of CEP genes in WT roots in response to a cytokinin (BAP 10−7 M) treatment for 3 h. qRT-PCR was used to measure the CEP gene expression levels in treated roots. The results were normalized relative to untreated roots. To highlight fold changes, the dotted line corresponds to a ratio of 1. Data points from four biological replicates are plotted as open circles (n ≥ 8). In a–c, center lines show the medians; box limits indicate the 25th and 75th percentiles as determined by the R software; whiskers extend 1.5 times the interquartile range from the 25th and 75th percentiles, outliers are represented by dots; and crosses represent sample means. Mann–Whitney test was used for each gene to assess significant differences between treated and control conditions, as indicated by asterisks (*α < 0.05; **α < 0.01; ***α < 0.001).
