Figure 1.
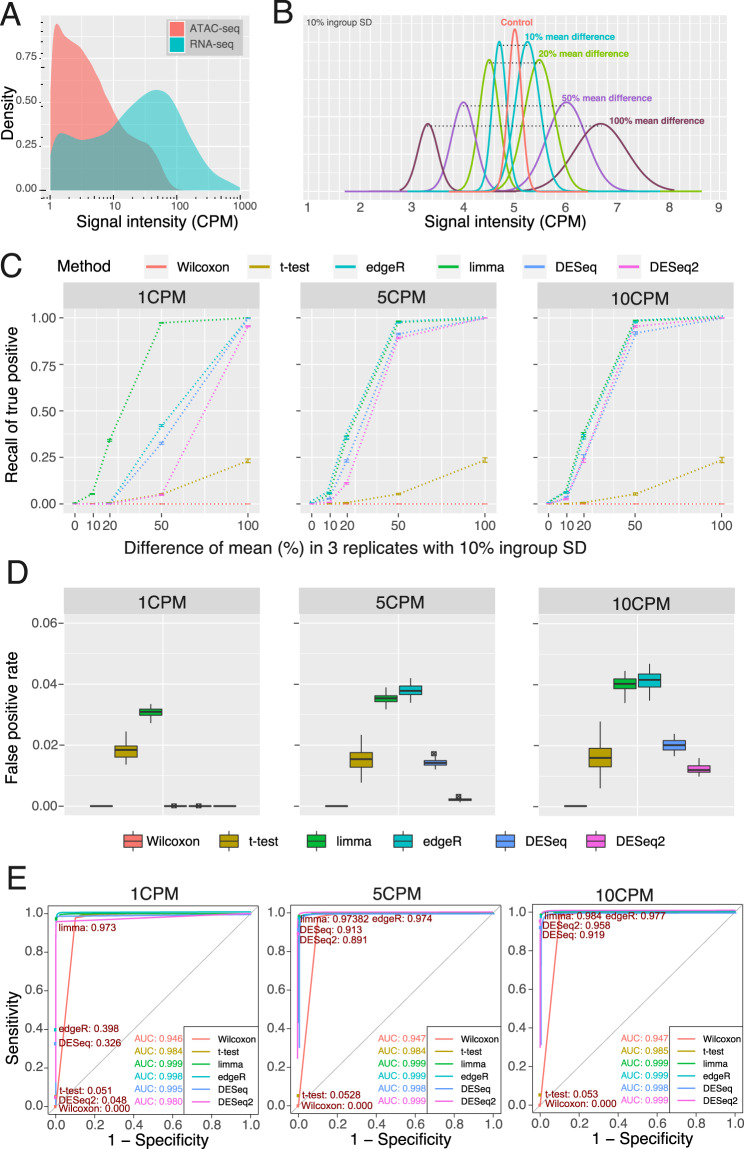
Illustration of simulation ATAC-seq data and the performance of six methods with three replicates. (A) Comparison of RNA-seq gene expression to ATAC-seq density. RNA-seq and ATAC-seq libraries for GM12878 were downloaded from SRA, aligned to hg38, and quantified for gene features for RNA-seq or density under peaks for ATAC-seq. Genes or peaks under 1CPM were excluded. The density of gene expression levels and peak densities was then plotted. (B) Simulated ATAC-seq peak density distributions. Simulated files of read counts under ATAC-seq peaks were generated as described in Methods such that they would have the desired read density under peaks. The density distribution of reads at 5 CPM with a 10% ingroup standard deviation is shown. 80% of peaks are generated as controls with equal average density in the two conditions. 5% of peaks were generated each with a 10%, 20%, 50%, or 100% mean density difference between the high density and low-density conditions. The sum of the average density of the two conditions was set as the control average density and the density difference was set such that the higher density condition had the desired density difference over the lower density condition. For example, for a 50% mean difference, the low-density condition had an average density of 4 CPM and the high density condition had an average density of 6 CPM such that their average density was 5 CPM and the high density condition was 50% more than 4 CPM. (C) Sensitivity of six methods with three replicates. Recall of true positives was plotted for six statistical methods as a function of increasing mean difference between high- and low-density conditions. Fifty simulated peaks files, each with over 300,000 peaks with 30 M effective reads in each file were generated as described in Methods. Average recall was plotted with error bars representing standard deviation of recall among the 50 peak files. Three replicates for the low density and high-density peaks were used in each file. (D) False Positive Rate of six methods with three replicates. The false positive rate was calculated for the six statistical methods by dividing the number of peaks with equal density identified as differentially accessible by the total number of differentially accessible regions identified for the 50 simulated peaks files. False positive rate was calculated separately for 1 CPM, 5 CPM, and 10 CPM using three replicates in each simulated peak file. Hinges represent the first and third quartiles. The line within the box is the median value. Whiskers extend to 1.5 times the inner quartile range. Points that are shown represent outlying points outside the whiskers. (E) ROC curves of six methods with three replicates. Peaks with 50% mean difference and 10% within group SD were extracted from the simulated peaks files used in (C) . ROC curves of sensitivity versus 1-specifity were plotted and the area under curve (AUC) calculated using the same conditions for (D). Filled circles represent the sensitivity and specificity at FDR < 0.05 with the sensitivity printed for each method.

