Figure 3.
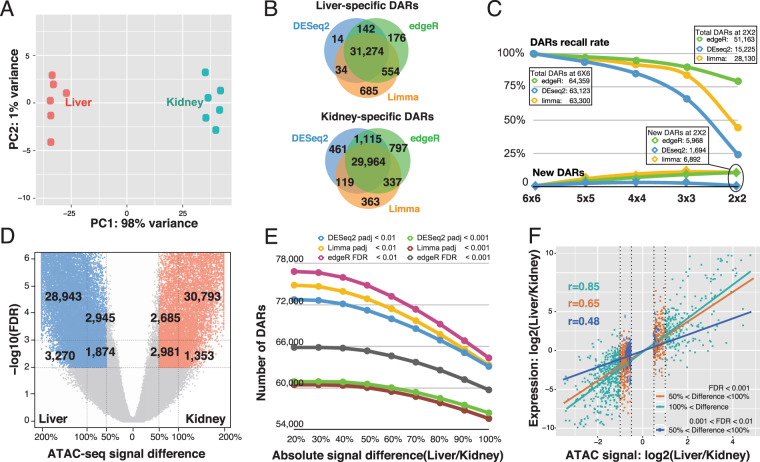
The performance of DESeq2, edgeR, and limma on real ATAC-seq data. (A) Principle Component Analysis of mouse liver and kidney ATAC-seq data. (B) Concordance of DARs identified by DESeq2, edgeR, and limma. (C) The effect of sample size on DARs identification by DESeq2, edgeR, and limma. X-axis indicates the sample size, Y-axis is the percentage of sensitivity (Recall rate) and false positive rate (New DARs). (D) Volcano-plot of DARs identified by edgeR. X-axis indicates the ATAC-seq signal difference between liver and kidney. (E) The effect of FDR/adjusted-p-value and signal difference on identification of DARs. X-axis is the absolute signal difference between liver and kidney. (F) Correlation between ATAC-seq signal and RNA-seq signal for DARs overlapping gene promoter. X-axis indicates the log2 transformed ATAC-seq signal difference between liver and kidney, y-axis indicates log2-transformed RNA-seq signal difference between liver and kidney.

