Figure 4.
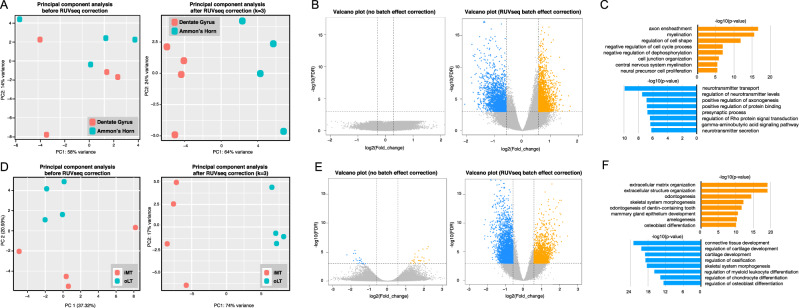
Batch-effect correction improved the performance of DAR analysis. (A) Principle Component Analysis of rat Dentate Gyrus and Ammon’s Horn ATAC-seq data before (left) and after (right) batch effect correction. (B) Volcano plots of DARs identified between Dentate Gyrus and Ammon’s Horn before (left) and after (right) batch effect correction. X-axis indicates the ATAC-seq signal difference between Dentate Gyrus and Ammon’s Horn. Y-axis indicates -log10(FDR). (C) GO enrichment analysis of genes around Dentate Gyrus (orange) and Ammon’s Horn (blue) DARs. (D) Principle Component Analysis of human healthy cartilage and osteoarthritis cartilage ATAC-seq data before (left) and after (right) batch effect correction. (E) Volcano plots of DARs identified between healthy cartilage and osteoarthritis cartilage before (left) and after (right) batch effect correction. (F) GO enrichment analysis of genes around osteoarthritis cartilage (orange) and human healthy cartilage (blue) DARs.

