
Figure 3.
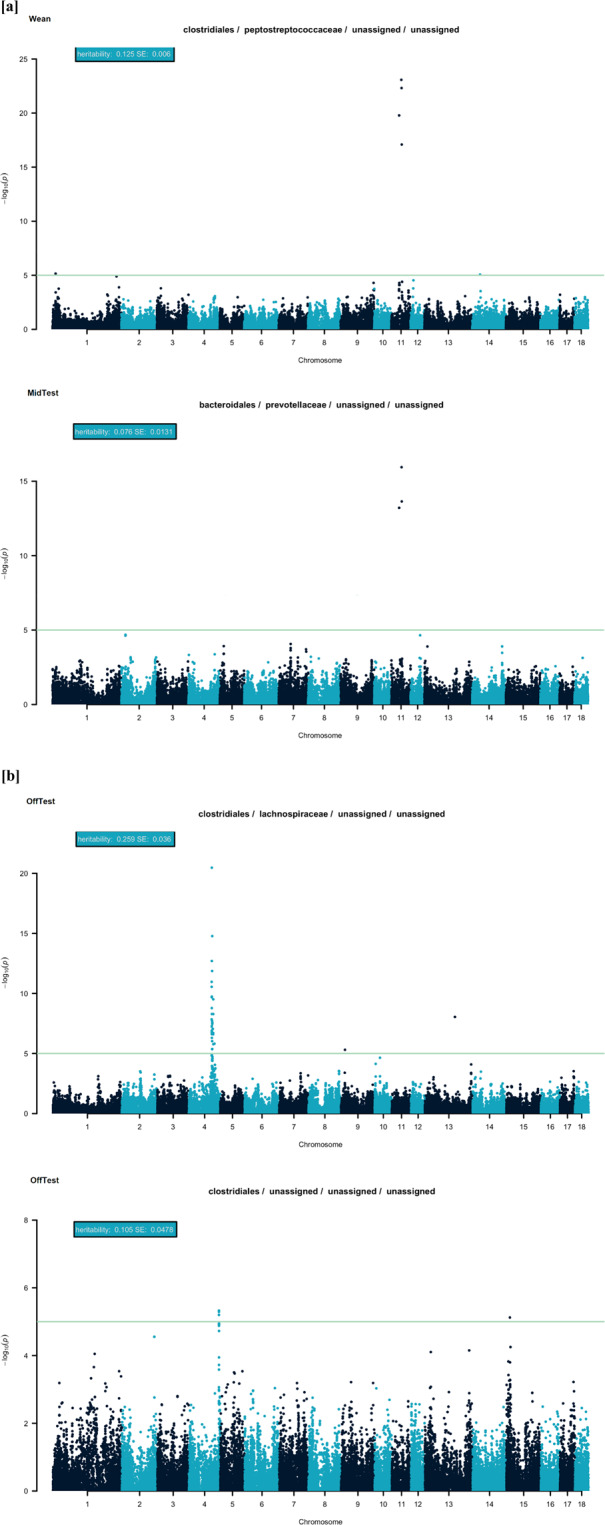
Manhattan plots for operational taxonomic units with at least one significant marker within Wean and MidTest [a], and OffTest [b]. The horizontal lines indicate the (P < 1 × 10⁻⁵) threshold for genome-wide significance.
Official websites use .gov
A
.gov website belongs to an official
government organization in the United States.
Secure .gov websites use HTTPS
A lock (
) or https:// means you've safely
connected to the .gov website. Share sensitive
information only on official, secure websites.
Manhattan plots for operational taxonomic units with at least one significant marker within Wean and MidTest [a], and OffTest [b]. The horizontal lines indicate the (P < 1 × 10⁻⁵) threshold for genome-wide significance.