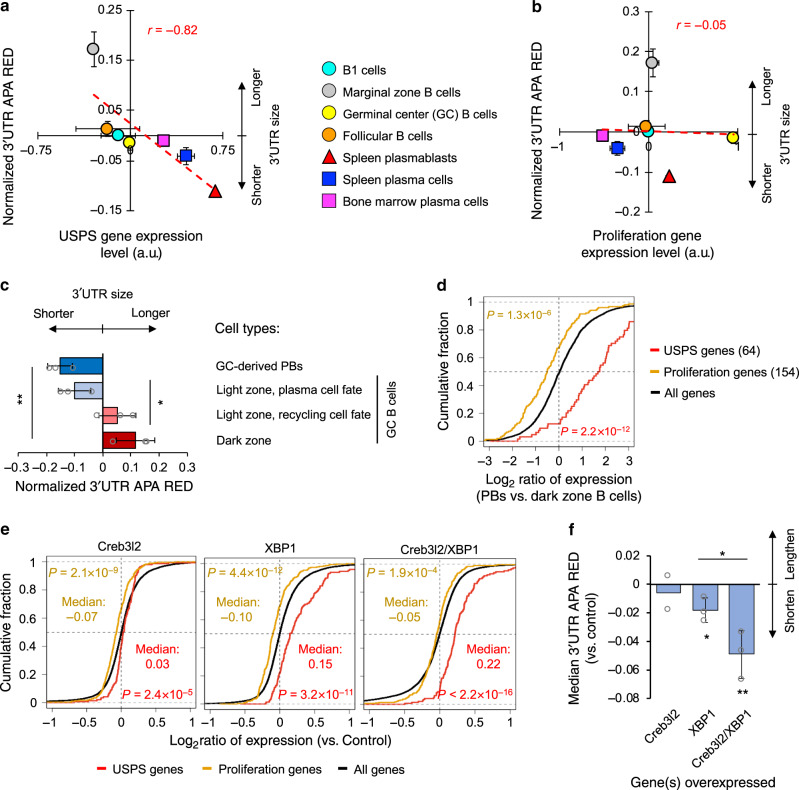
Fig. 7. Additional systems supporting SCAP.
a Correlation between 3ʹUTR APA REDs and USPS gene expression levels across different types of B cells and plasma cells (a study by Shi et al.43). 3ʹUTR APA REDs are normalized to the median of all samples. Pearson correlation coefficient (r) is indicated. There are two samples for each cell type except for spleen plasmablasts (1 sample), spleen plasma cells (3 samples), and bone marrow plasma cells (1 sample). Data are presented as mean value+/− SD. a.u., arbitrary unit. b As in a, except that correlation between 3ʹUTR APA REDs and proliferation gene expression level is shown. c 3ʹUTR APA REDs for different types of B cells in the germinal center (GC) and GC-derived plasmablast (PB)(a study by Ise et al.44). 3ʹUTR APA REDs are normalized to the median of all samples. Data are presented as mean value+/− SD of three replicates. Significance of difference (t-test) between cell groups is indicated. Plasma cell fate B cells in the light zone are Bcl6low and CD69high cells, and recycling cell fate B cells are Bcl6high and CD69high cells. d CDF curves of gene expression changes for USPS (red) and proliferation (orange) genes in GC-derived PBs vs. dark zone B cells. Number of genes in each set is indicated. P-values (K–S test) for significance of difference between each gene set and all genes are indicated. e CDF curves of gene expression changes for USPS genes (red, 145), proliferation genes (orange, 298), and all genes in AtT-20 cells with overexpression of indicated gene(s) vs. control cells (a study by Khetchoumian et al.45). P-values (K–S test) for significance of difference between gene sets are indicated. f Bar plot of median 3ʹUTR APA REDs for the samples in e. Data are presented as mean value+/– SD based on two (Creb3l2) or three (XBP1 and Creb3l2/XBP1) replicates. Significance of difference (t-test) vs. control or between cell groups is indicated.

