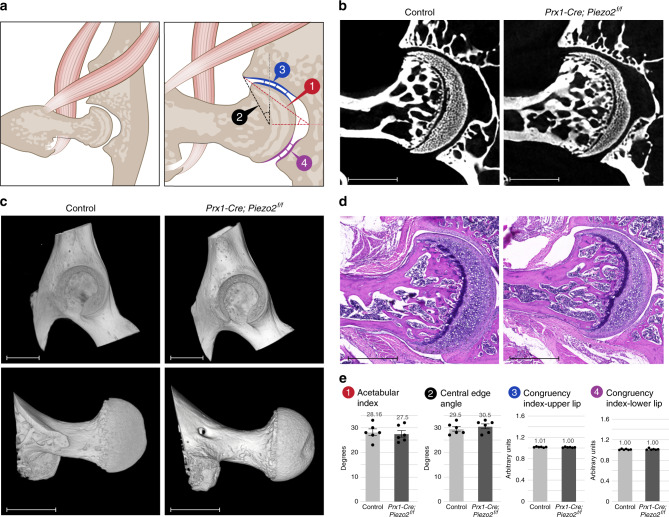
Fig. 1. Loss of Piezo2 in mesenchyme-derived tissues did not result in morphological changes of the hip joint.
a Illustrations of the hip joint showing the indices used to evaluate hip dysplasia. The red lines (1) mark the acetabular index, the black lines (2) mark the central edge angle, the blue (3), and purple (4) lines mark the zones of measurements for the congruency index in the upper and lower lip of the hip joint, respectively. b Ex vivo CT-scanned hip joints of representative P60 control (left) and Prx1-Cre; Piezo2f/f (right) mice (n = 6 in both groups). c 3D reconstruction of ex vivo CT scans of representative P60 control (left) and Prx1-Cre; Piezo2f/f (right) mice showing no signs of dysplasia of the acetabulum (top) or the femoral head (bottom). Data are from three independent experiments. d Histological H&E-stained sections of hip joints of representative P60 control (left) and Prx1-Cre; Piezo2f/f (right) mice showing no remarkable differences in the morphology of the hip. Data are from three independent experiments. e Graphs showing the measured values of the indices illustrated in a for P60 control (n = 6) and Prx1-Cre; Piezo2f/f (n = 6) mice. No significant differences were found in any of the measurements, as determined by Welch’s two-sample t-test, ruling out the existence of hip dysplasia upon ablation of Piezo2 in mesenchymal cells. P-values: 1, 0.73; 2, 0.47; 3, 0.32; 4, 0.9. Bar and whiskers represent mean value and SEM, respectively. Source data are provided as a Source Data file. Scale bars: 380 µm in b, 850 µm in (c, top), 770 µm in (c, bottom) and 510 µm in d.

