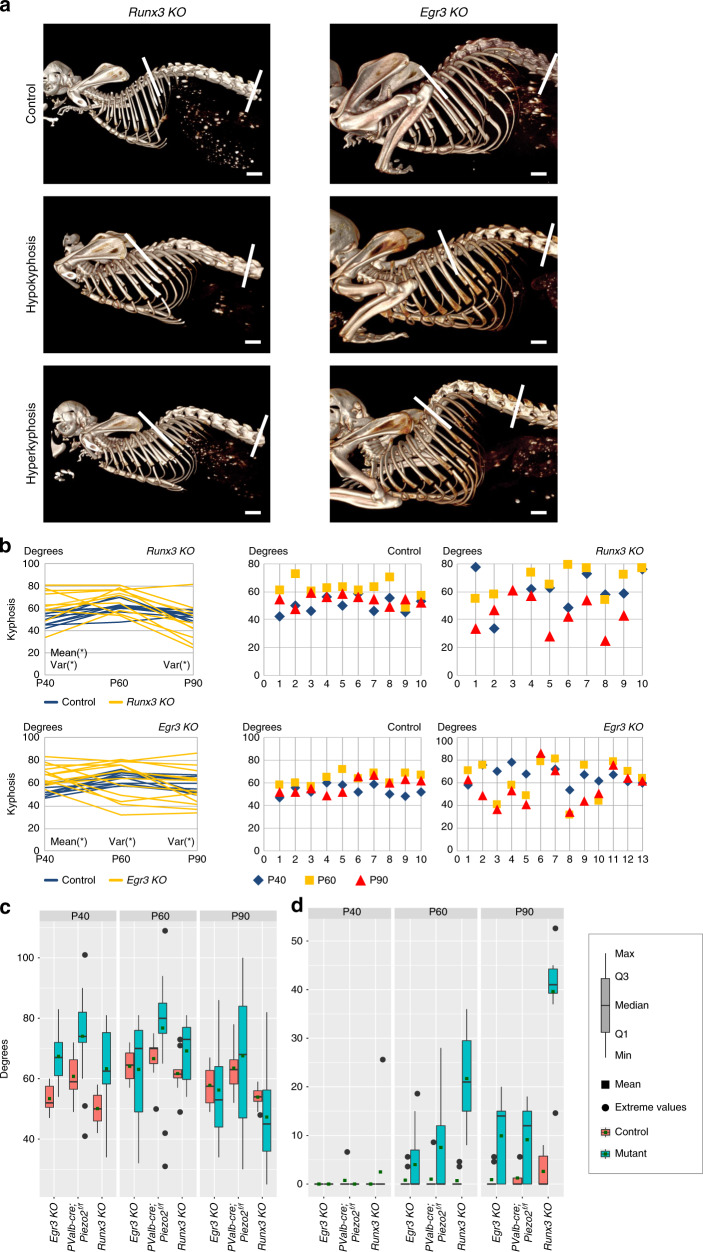
Fig. 4. Comparative analysis of spine malalignment in Runx3 KO, Egr3 KO, and PValb-cre;Piezo2f/f mice.
a In vivo CT-scanned skeletal images of representative control, Runx3 KO and Egr3 KO mice at P60 showing kyphosis in the KO mice but not in the control. b Graphs showing Cobb angles for all Runx3 KO (top right, n = 10) and Egr3 KO mice (bottom right, n = 10) and their controls (left, n = 10 for each group). Two graphs on the left show the dynamics of Cobb angle for each measured mouse from P40 through P60 to P90. As in PValb-cre;Piezo2f/f mice, kyphosis was found to be progressive in most mutant animals between P40 and P60, with partial improvement at P90. Significance of t—or F-test is marked by “mean (*)” or “var (*)”, respectively. P-values for Runx3 KO: at P40, p = 0.02 (t-test) and p = 0.006 (F-test); at P60, p = 0.07 (t-test) and p = 0.19 (F-test); at P90, p = 0.26 (t-test) and p = 0.0001 (F-test). P-values for Egr3 KO: at P40, p = 0.00006 and p = 0.07; at P60, p = 0.83 and p = 0.001; at P90, p = 0.74 and p = 0.01 (t—and F-test, respectively). Source data are provided as a Source Data file. c, d Box plots showing measurements of kyphosis (c) and scoliosis (d) in PValb-Cre;Piezo2f/f (ncKO = 17; ncontrol = 8), Runx3 KO (nKO = 10; ncontrol = 10), and Egr3 KO mice (nKO = 13; ncontrol = 10), at P40, P60, and P90. Scale bars: 2.4 mm in (a, top left), 1.7 mm in (a, middle left), 2 mm in (a, bottom left), 2 mm in (a, right; estimated based on measurements of animals of the same background and age).

