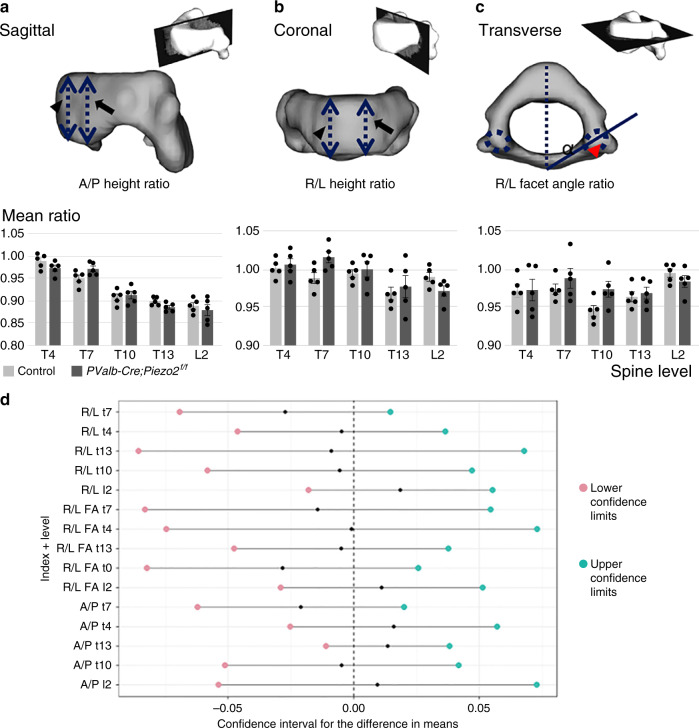
Fig. 5. Vertebral shape is unaffected in PValb-Cre;Piezo2f/f mice.
Reconstructed CT-scanned images of vertebrae illustrate the measured features (a–c): The ratios between anterior (dashed line indicated by arrowhead) and posterior (dashed line indicated by arrow) heights (a, sagittal plane, A/P ratio), between right (arrowhead) and left (arrow) heights (b, coronal plane, R/L ratio) and between right (dashed circle indicated by arrowhead) and left (dashed circle) superior facet angles (c, transverse plane, R/L facet angle ratio). Graphs below show the morphometric similarity between PValb-Cre;Piezo2f/f (dark gray) and control (light gray) mice (n = 5 in each group). A/P anterior/posterior, R/L right/left. d Graph showing the 95% confidence intervals for differences in mean ratios. Red and green dots indicate upper and lower confidence limits, respectively, and black dots indicate the difference between control and mutant means ratio, which did not exceed the −0.1 to 0.1 range in all indices and at all levels. Data are presented as mean ± SEM; ncontrol = 5, ncKO = 5. Source data are provided as a Source Data file.

