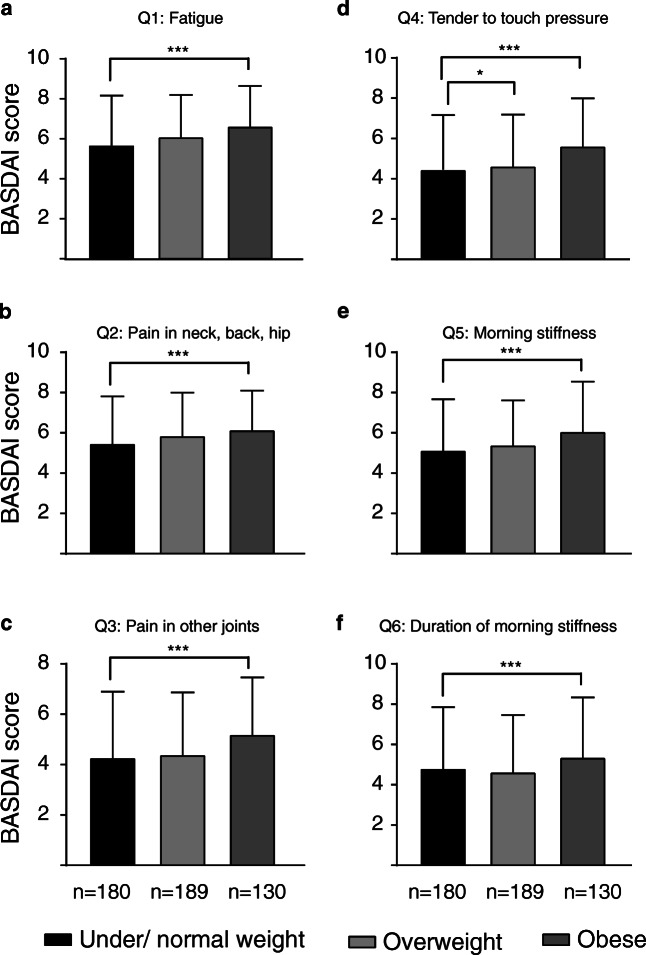
Fig. 2.
Disease activity as shown by individual BASDAI questions in under/normal weight, overweight, and obese patients. Patients were classified into groups based on BMI as described in the “Methods” section. The number of patients in each group is indicated under the representative bar. Obese patients reported higher scores on all six individual BASDAI questions (Q1–Q6) related to disease activity as compared to normal weight. All values are mean ± SD. *p < 0.05, ***p < 0.001 by Student’s t test

