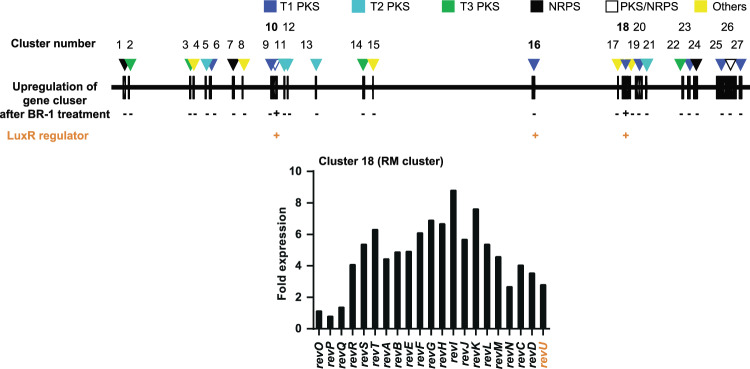
Figure 2.
Effects of BR-1 on Streptomyces sp. SN-593. Linear map of the 2 producer Streptomyces sp. SN-593 genome with putative 27 gene clusters. Following RNA-sequence analysis, fold-expressions of all gene clusters were analysed (Table S1). Gene-cluster upregulation by BR-1 is indicated by ‘+’ and ‘−’. The presence of LuxR family transcriptional regulator in the cluster is indicated by ‘+’. T1PKS: type I PKS; T2PKS: type II PKS; T3PKS: type III PKS; NRPS: nonribosomal peptide synthetase.

