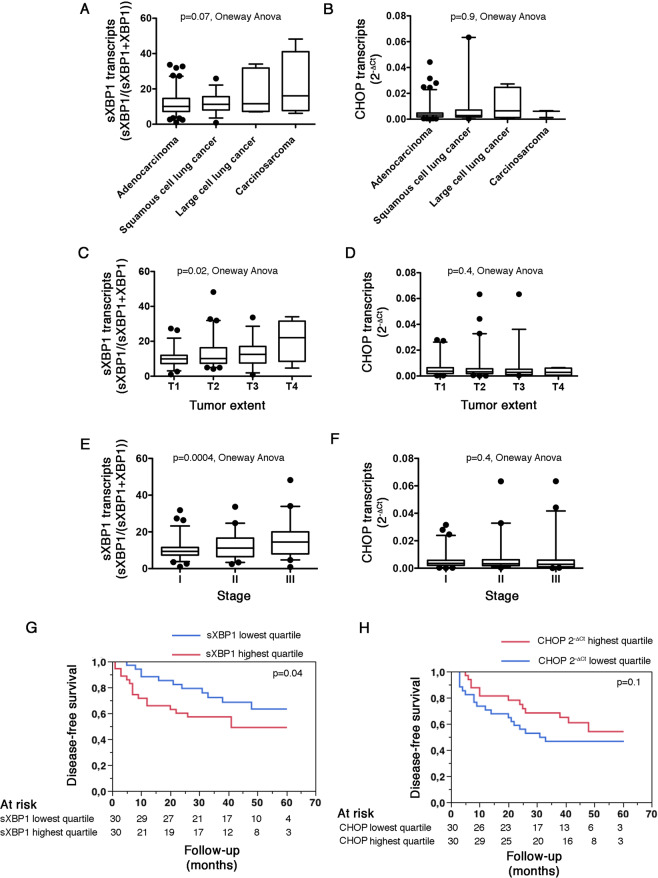
Figure 1.
The IRE1-sXBP1 pathway is activated NSCLC and correlate with tumor aggressiveness. A. Box and whiskers plots representing the amount of sXBP1 transcripts measured by fragments analysis in NSCLC tumor samples, classified according to the histological type of cancer. sXBP1 expression is calculated as sXBP1 peak intensity/(sXBP1 + XBP1 peak intensity). Oneway analysis of variance. B. Box and whiskers plots representing the amount of CHOP transcripts measured by RT-qPCR in NSCLC tumor samples, classified according to the histological type of cancer. CHOP relative expression levels are measured as cycle thresholds normalized to endogenous gene control (Ct). Oneway analysis of variance. C. Box and whiskers plots representing the amount of sXBP1 transcripts measured by fragments analysis in NSCLC tumor samples, classified according to the size and extend of the tumor. sXBP1 expression is calculated as sXBP1 peak intensity/(sXBP1 + XBP1 peak intensity). Oneway analysis of variance. D. Box and whiskers plots representing the amount of CHOP transcripts measured by RT-qPCR in tumor samples, classified according to the stage of the tumor. CHOP relative expression levels are measured as cycle thresholds normalized to endogenous gene control (Ct). Oneway analysis of variance. E. Box and whiskers plots representing the amount of sXBP1 transcripts measured by fragments analysis in NSCLC tumor samples, classified according to the stage of the tumor. sXBP1 expression is calculated as sXBP1 peak intensity/(sXBP1 + XBP1 peak intensity). Oneway analysis of variance. F. Box and whiskers plots representing the amount of CHOP transcripts measured by RT-qPCR in tumor samples, classified according to the size and extend of the tumor. CHOP relative expression levels are measured as cycle thresholds normalized to endogenous gene control (Ct). Oneway analysis of variance. G. Kaplan-Meier curves for the association between the amount of sXBP1 transcripts in tumor samples and disease-free survival in the cohort of 165 patients with NSCLC, according to highest (red curve) and lower (bleu curve) quartiles of sXPB1 distribution, measured as sXBP1 peak intensity/(sXBP1 + XBP1 peaks intensity). Wilcoxon test. H. Kaplan-Meier curves for the association between the amount of CHOP transcripts in tumor samples and disease-free survival in the cohort of 165 patients with NSCLC, according to highest (red curve) and lower (bleu curve) quartiles of CHOP distribution. Wilcoxon test.

