Figure 3.
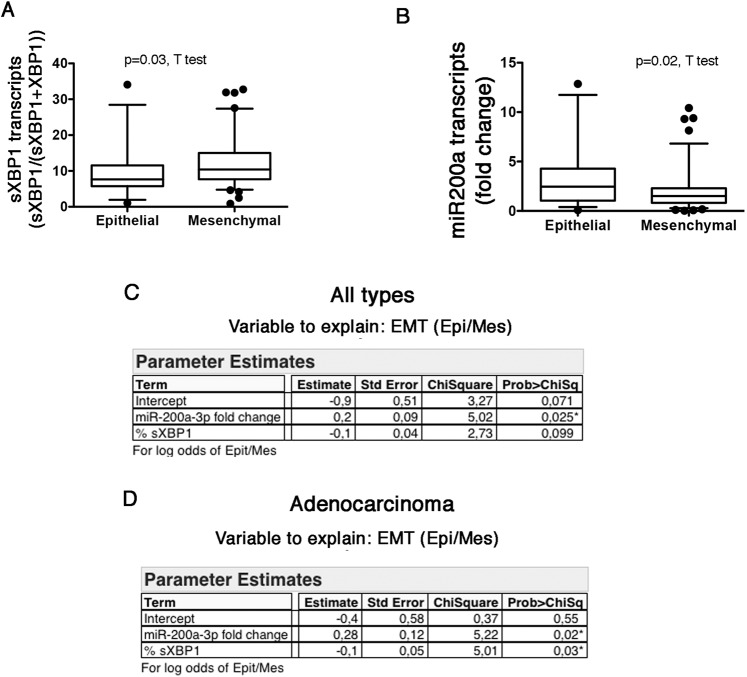
Association of sXBP1 with the EMT program in NSCLC. A. Box and whiskers plots representing distribution of the amount of sXBP1 transcripts measured by fragments analysis in tumor samples, according to the EMT class (epithelial or mesenchymal). B. Box and whiskers plots representing distribution of the amount of miR200a transcripts measured by fragments analysis in tumor samples, according to the EMT class (epithelial or mesenchymal). C. Multiple logistic regression analysis between EMT class (Epithelial/Mesenchymal) and miR-200a and sXBP1 as explanatory variables in all the types of cancer. D. Multiple logistic regression analysis between EMT class (Epithelial/Mesenchymal) and miR-200a and sXBP1 as explanatory variables in adenocarcinoma.

