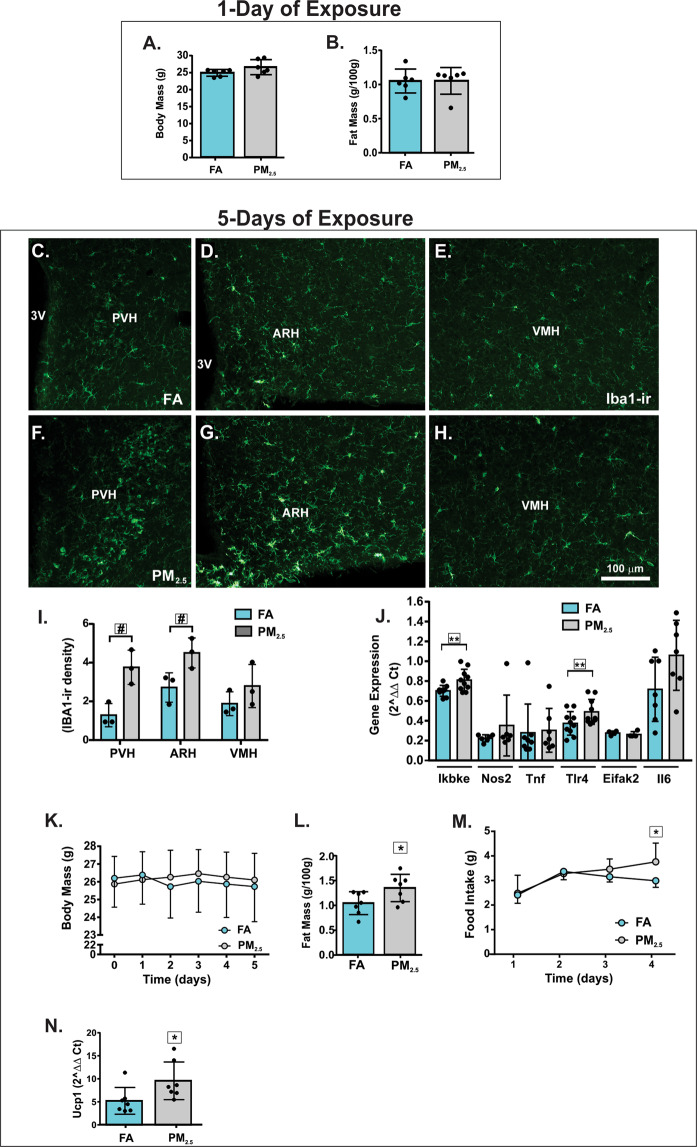
Figure 1.
Progressive exposure to PM2.5 increases fat mass and food intake and triggers hypothalamic inflammation. Mice were exposed to particulate matter less than 2.5 micrometers in diameter (PM2.5) or filtered air (FA) for 1 day or 5 days, as indicated in the Fig. (A) body mass (g) n = 6 for each group. (B) Fat mass (g/100 g of body mass) n = 6 for each group. Epifluorescence photomicrographs showing Iba1-immunoreactivity (Iba1-ir) in the hypothalamamic nuclei of mice exposed to FA (C to E) or PM2.5 (F to H) for 5 days n = 3 for each group. (I) Iba-1-ir density expression in hypothalamic nuclei of mice exposed to FA or PM2.5 for 5 days. (J) Hypothalamic gene expression of inflammatory markers from mice exposed to PM2.5 for 5 days n = 4–10. (K) body mass (g) n = 7 for each group. (L) Fat mass (g/100 g of body mass) n = 7 for each group. (M) Food intake (g) n = 7 for each group. (N) Ucp1 gene expression in the brown adipose tissue (BAT) (2^ΔΔ Ct) n = 7 for each group. Abbreviations: 3 V, third ventricle; ARH, arcuate nucleus; PVH, paraventricular nucleus; VMH, ventromedial nucleus of the hypothalamus; Ikbke - inhibitor of nuclear factor kappa-B kinase subunit epsilon; Nos2 - inducible nitric oxide synthase 2; Tnf - Tumor necrosis factor alpha; Tlr4 - Toll-like receptor 4; Eifak2 - Eukaryotic translation initiation factor-α kinase 2; Il6 - Interleukin 6. All of the mice studied were 6–8 weeks of age. Data were presented as the mean ± SD. Unpaired t test (two-tailed) was used for the statistical analysis of Panels A, B, D and F and two-way ANOVA followed by the Tukey post hoc test was used for statistical analysis of Panels C and E. *P < 0.05 vs FA, #P < 0.05 vs FA (same hypothalamic nuclei), **P < 0.05 vs FA (same gene).

