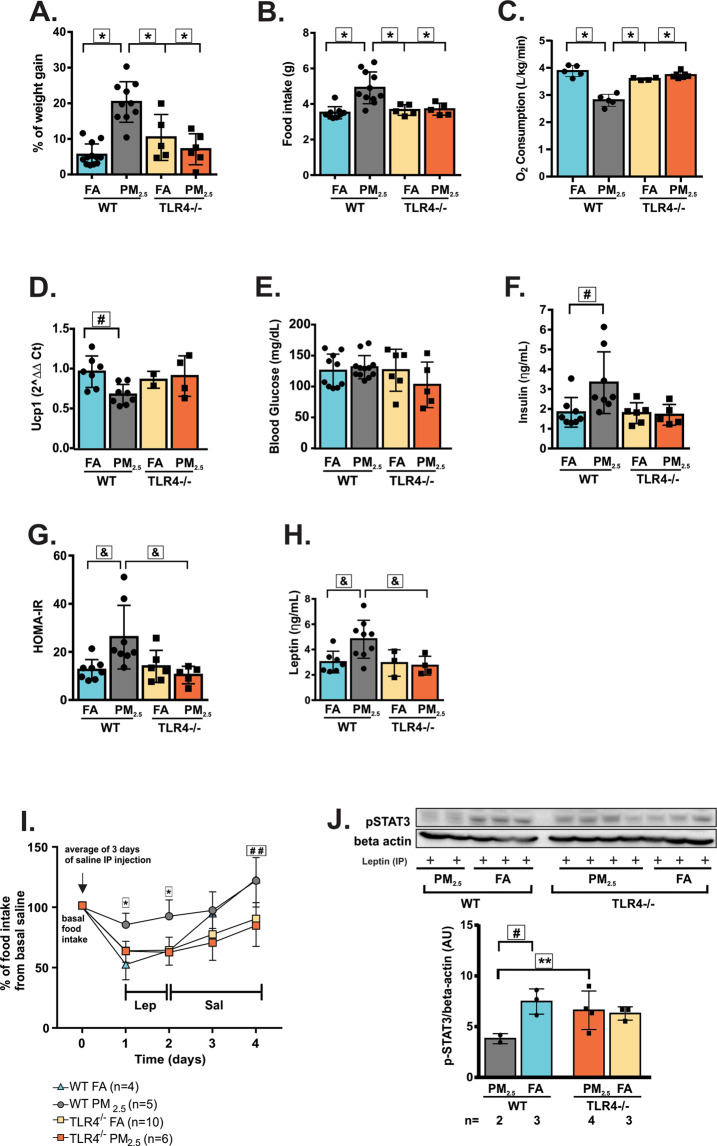
Figure 4.
Deletion of TLR4 protected mice from leptin resistance and obesity induced by chronic exposure to PM2.5. TLR4−/− and WT mice were exposed to particulate matter less than 2.5 micrometers in diameter (PM2.5) or filtered air (FA) for 12 weeks. (A) Percent of weight gain from the beginning of exposures. (B) Food intake (g). (C) O2 consumption (L/kg/min). (D) Ucp1 gene expression in the brown adipose tissue (E) Fasting blood glucose (mg/dL). (F) Fasting serum insulin (ηg/mL). (G) Homeostasis model assessment (HOMA-IR) index. (H) Fasting serum leptin levels (ηg/mL). (I) Intraperitoneal (IP) leptin sensitivity test. (J) STAT3 phosphorylation (Arbitrary Units) in response to IP leptin injection was measured in the hypothalamus of overnight fasted mice (full-length gels are presented in Supplementary Fig. 1B). All of the mice studied were 6–8 weeks of age. Data were presented as the mean ± SD. Two-way ANOVA (considering the genotypes and exposures as 2 different factors) followed by a post hoc test were used for the statistical analysis. *P < 0.05 vs WT FA, TLR4−/− FA and PM2.5; #P < 0.05 vs WT FA; &p < 0.05 vs WT FA and TLR4−/− PM2.5; ##P < 0.05 vs TLR4−/− FA and PM2.5; **P < 0.05 vs TLR4−/− PM2.5. Letters A–H: WT FA n = 5–11; WT PM2.5 n = 5–13; TLR4−/− FA n = 2–6; TLR4−/− PM2.5 n = 4–7.

