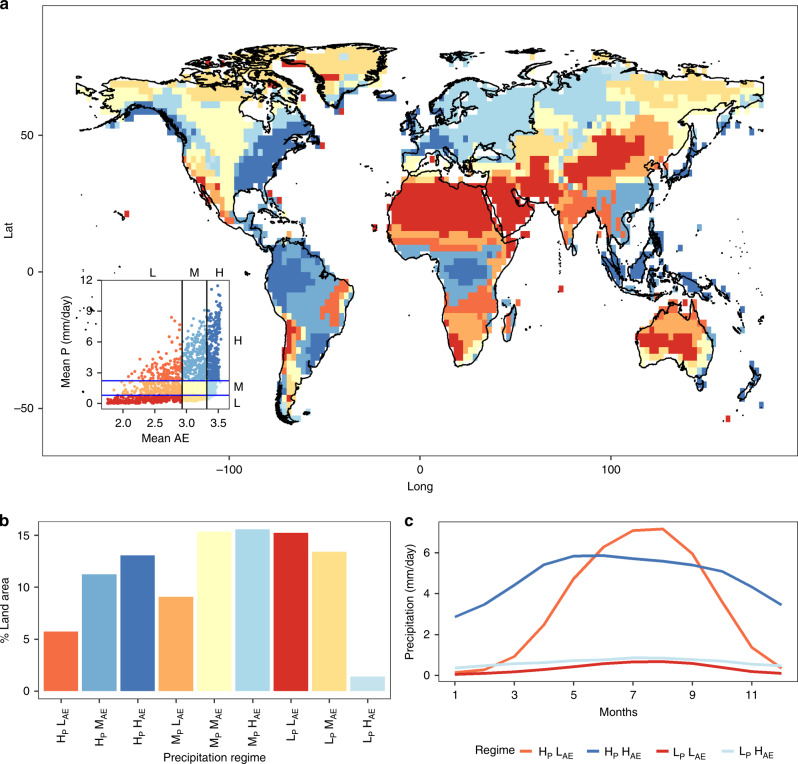
Fig. 1. Classification of the precipitation regimes.
a Spatial distribution of precipitation regimes based on the percentile (Pri) thresholds concept using mean apportionment entropy (AE) and annual precipitation P during the 1971–2000 reference period. b Percentage of land occupied by each regime. c Precipitation climatology of the spatially aggregated monthly rainfall climatology for regimes HPLAE, HPHAE, LPHAE, LPLAE. These regimes are selected as they represent boundary case scenarios. H, M, and L represent high moderate and low values, respectively.

