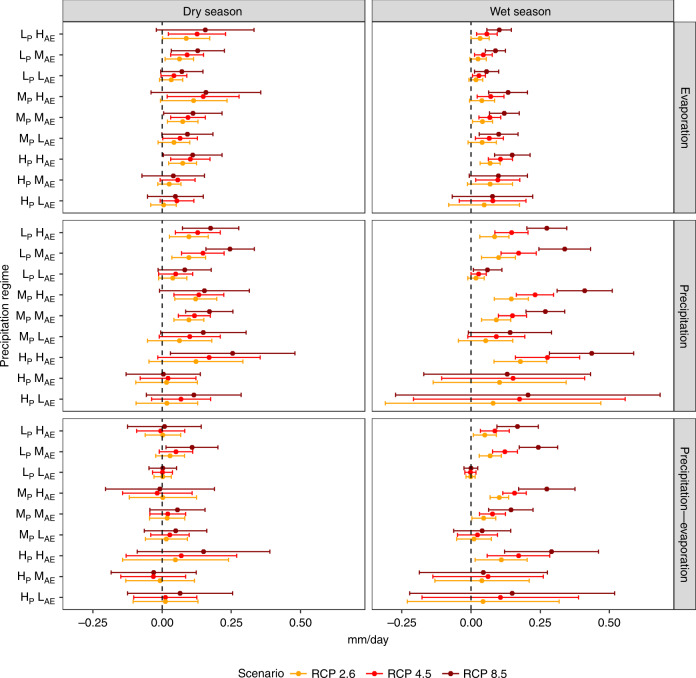
Fig. 4. Projected seasonal changes in precipitation, evaporation, and available water.
Relative changes in future precipitation and evaporation during the wet (three-month average with maximum precipitation in a year) and dry seasons (three-month average with minimum precipitation in a year) derived based on the CMIP5 scenario relative to the historical period (1971–2000). The error bars surrounding the point estimates represent the 95% confidence interval of the CMIP5 multimodel ensemble. H, M, and L abbreviate high moderate and low values, respectively. Whereas, apportionment entropy is abbreviated as AE and annual precipitation as P.

