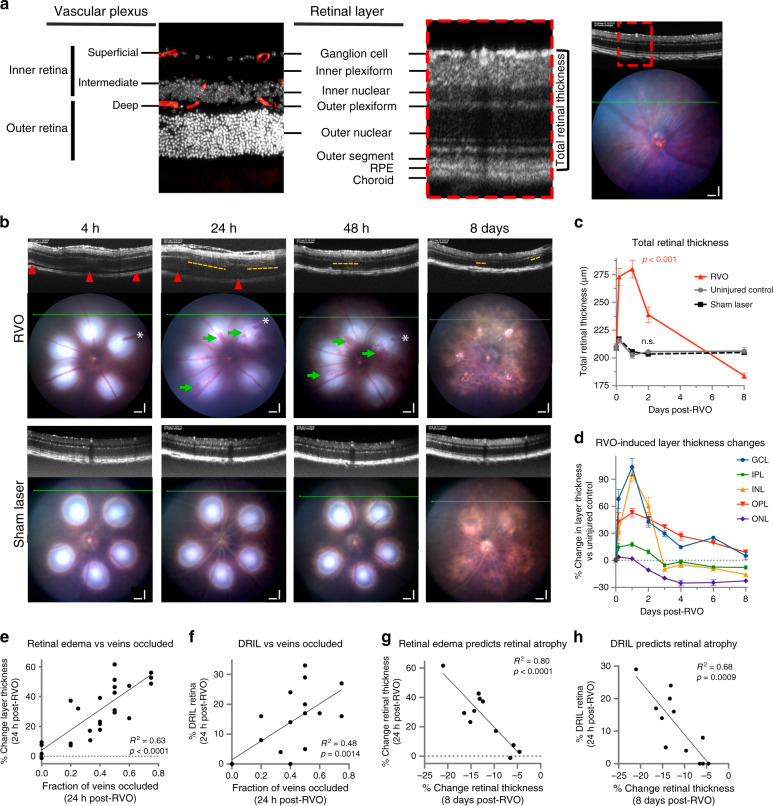
Fig. 1. In vivo ophthalmic imaging measures pathological changes following laser-induced RVO.
a Comparative representation of retinal layer segmentation and vascular plexi as observed by immunostaining (left; red = isolectin, white = DAPI, n = 6) and optical coherence tomography (OCT, n = 18) in vivo imaging (right) in uninjured adult C57/Bl6J mouse. Scale bar = 100 μm. b OCT and fundus retinal imaging at 4 h, 24 h, and 48 h, and 8 days post-RVO (n = 10, 21, 14, 16) or sham laser (n = 14). Retinal detachment (red arrowheads) and DRIL (yellow dashes) indicated on OCT imaging, and vein occlusions (white asterisks (*)) and retinal hemorrhages (green arrows) marked on fundus imaging. Scale bar = 100 μm. c Quantification of total retinal thickness in uninjured controls (n = 6), sham laser (n = 14), and RVO + Pen1 treated eyes (n = 10, 21, 14, 16) at 4 h, 24 h, 48 h, and 8 days. One-way ANOVA with Fisher’s LSD performed for each time-point; mean ± SEM. d Quantification of change in thickness of individual retinal layers (n = 10, 21, 14, 13, 4, 4, 16) at 4 h, 24 h, 48 h, 3 d, 4 d, 6 d, 8 d; mean ± SEM). e Retinal swelling is correlated to fraction of veins occluded at 24 h post-RVO (linear regression, n = 25). f DRIL is correlated to the fraction of veins occluded at 24 h post-RVO (linear regression, n = 25). g Retinal swelling 24 h post-RVO is correlated to retinal thinning 8 days post-RVO (linear regression, n = 25). h DRIL 24 h post-RVO is correlated to retinal thinning 8 days post-RVO (linear regression, n = 25). Source data are provided as a Source Data file.

