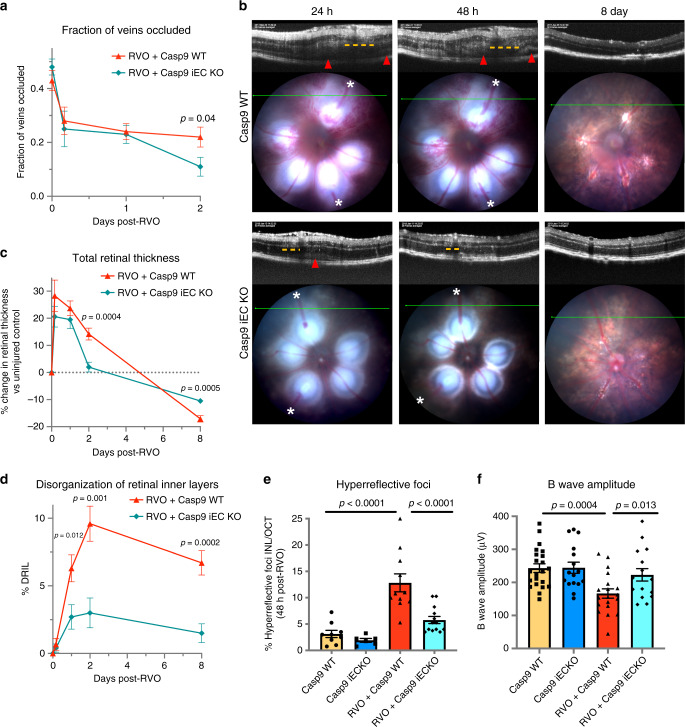
Fig. 8. Endothelial caspase-9 contributes to retinal injury following RVO.
a Quantification of the fraction of veins occluded immediately after induction of RVO, and at 4 h, 24 h, and 48 h post-RVO. (RVO + Casp9 WT, n = 50, 19, 42, 17) (RVO + Casp9 iEC KO, n = 50, 16, 40, 24) two-tailed Welch’s t test; mean ± SEM. b OCT and fundus retinal imaging from Casp9 WT and Casp9 iEC KO mice at 24 h, 48 h, and 8 days post-RVO. Retinal detachment (red arrowhead) and regions of DRIL (yellow dashes) indicated on OCT, vein occlusions (white asterisks (*)) indicated on fundus image. c Quantification of the change in total retinal thickness vs. uninjured control in Casp9 WT (n = 12, 22, 12, 10) and Casp9 iEC KO (n = 7, 19, 11, 13) eyes at 4 h, 24 h, 48 h, and 8 days post-RVO. Two-tailed Welch’s t test; mean ± SEM. d Quantification of DRIL in Casp9 WT (n = 12, 22, 12, 10) and Casp9 iEC KO (7, 19, 11, 13) eyes at 4 h, 24 h, 48 h, and 8 days post-RVO. Two-tailed Welch’s t test; mean ± SEM. e Quantification of HRF in uninjured and 48 h post-RVO in Casp9 WT (uninjured n = 9, RVO n = 11) and Casp9 iEC KO eyes (uninjured n = 6, RVO n = 13), one-way ANOVA with Fisher’s LSD; mean ± SEM. f Quantification of b wave amplitude 7 days post-RVO in Casp9 WT (uninjured n = 22, RVO n = 19) and Casp9 iEC KO eyes (uninjured n = 16, RVO n = 16) (flash intensity = 2.3 log(Cd/m2); one-way ANOVA with Fisher’s LSD; mean ± SEM. Source data are provided as a Source Data file.

