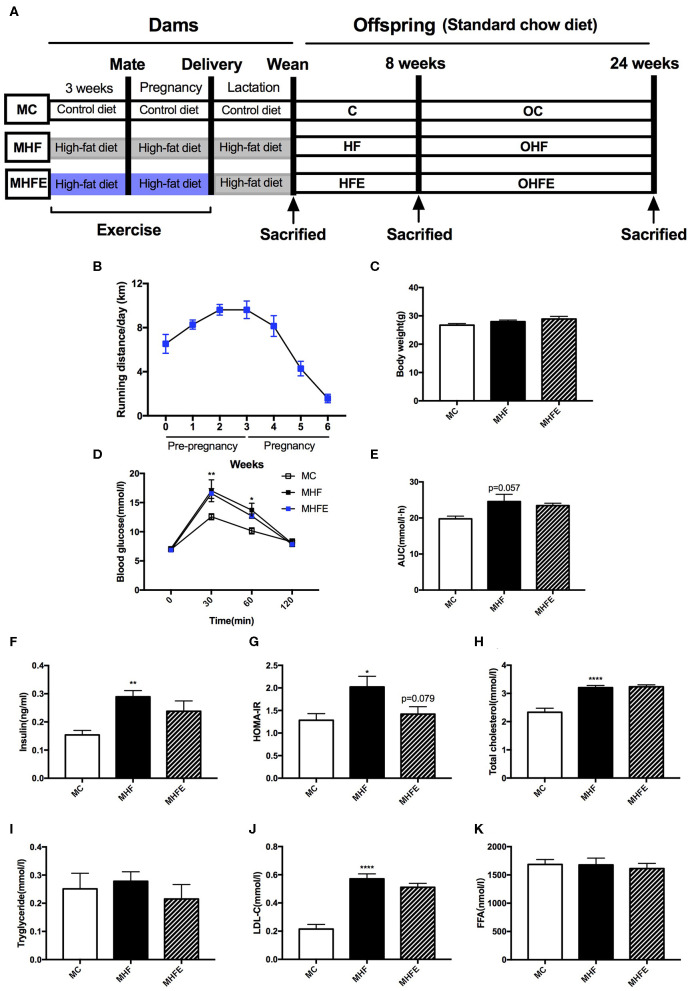
Figure 1.
Glucose and lipid metabolism in dams at weaning. (A) Experimental scheme; (B) Average running distance per day of dams during 3 weeks before mating and throughout pregnancy; (C) Body weight in mothers at weaning; (D) Maternal blood glucose values following an intraperitoneal glucose tolerance test at weaning; (E) AUC of blood glucose values during an intraperitoneal glucose tolerance test; Insulin sensitivity analyses of dams: (F) Fasting insulin levels at weaning; and (G) HOMA-IR; Maternal serum lipid profiles at weaning: (H) TC; (I) TG; (J) LDL-C; and (K) FFA. MC, dams fed the normal control diet; MHF, dams fed the high-fat diet; MHFE, dams intervened with a high-fat diet and exercise. AUC, area under the curve; HOMA-IR, homeostasis model assessment of insulin resistance; TC, total cholesterol; TG, triacylglycerol; LDL-C, low-density lipoprotein cholesterol; FFA, free fatty acid. All of the data are expressed as means ± S.E.M. (MC, n = 8; MHF, n = 11; MHFE, n = 8 in each figure). The statistics were analyzed by one-way ANOVA and two-way ANOVA, with Turkey post hoc analyses. Mean values show significant differences between the MC group and the MHF group: *p < 0.05, **p < 0.01, ****p < 0.0001.

