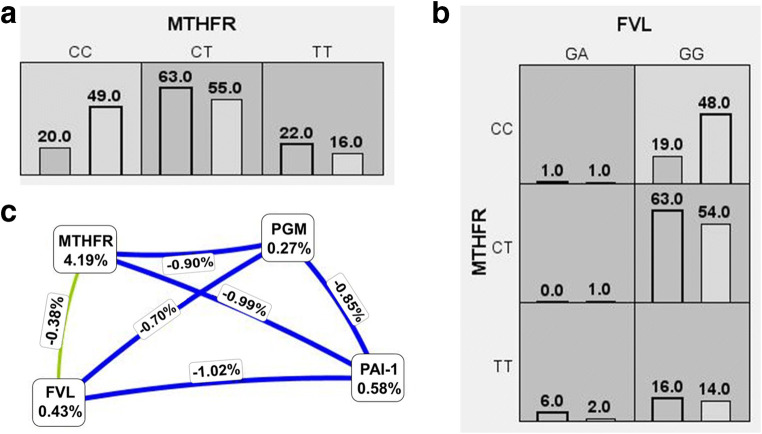
Fig. 1.
Low- and high-risk genotype combinations of one (A) and two-locus (B) model and cluster analysis of Fruchterman-Reingold dendogram (C). High-risk genotypes are presented with the dark gray cells. Left bar in each cell corresponds to the number of patients and right bar to the number of controls. Interaction graph is based on entropy. Entropy values of the SNPs are marked in the cells, showing the main independent effects, and those on the lines represent the entropy of interaction. The independent effect is shadowed green, while blue denotes absence of interaction

