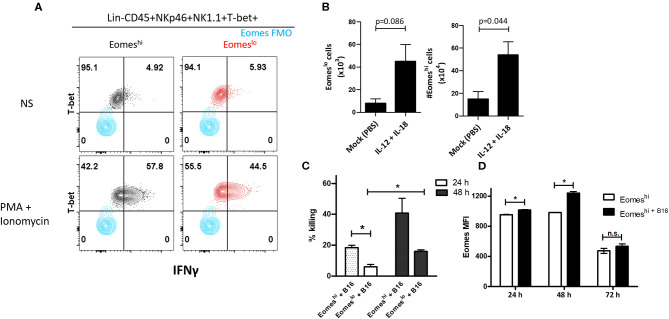
Figure 5.
Eomes upregulation is correlated with Group 1 ILC-mediated cytotoxicity. (A) Representation of IFNγ expression in Eomeslo and Eomeshi subsets relative to FMO controls; red—Eomeslo, black—Eomeshi; Cells were isolated and stimulated ex vivo with PMA and Ionomycin (NS = non-stimulated) (B) Increase in Eomeslo and Eomeshi cell numbers in response to IL-12 and IL-18 stimulation in vivo. The lungs were harvested, and cells were counted at day 7. Here, n = 4 biological replicates. (C) Percentage killing of B16F10 melanoma cells by Eomeshi subset relative to Eomeslo cells at 24 and 48 h, normalized to spontaneous death (B16F10 only). (D) Measurement of Eomes MFI across 24, 48, and 72 h in flow-sorted murine Eomeshi Group 1 ILC in co-culture with B16F10 cells compared to Eomeshi subset alone. Cells were isolated from Eomes-GFP reporter mice; Eomes MFI is indicative of GFP MFI in the cells. Target to Effector ratio (T:E) was maintained at 4:1. MFI, Mean Fluorescence Intensity, n = 3 technical replicates, Data are representative of three independent repeats; data are presented as mean ± s.e.m.; Significance was tested using two-tailed students' t-test; n.s., not significant *p < 0.05.

