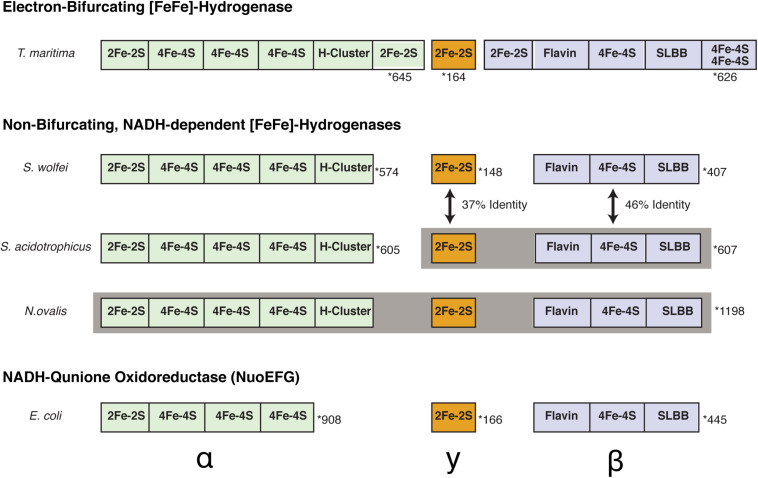
FIGURE 3.
Comparison of subunit compositions and domains between S. aciditrophicus HydAB, S. wolfei Hyd1ABC, and N. ovalis [FeFe]-hydrogenases. Cofactor binding sites are orientated from the N-terminal to C-terminal portion of each subunit. Gray shading indicates subunits that are fused together into a single polypeptide chain. The number of total amino acid residues for each is displayed to the right and is marked with a star. The peptides and domains are not scaled proportionally to accurately reflect number of amino acids in each subunit.

