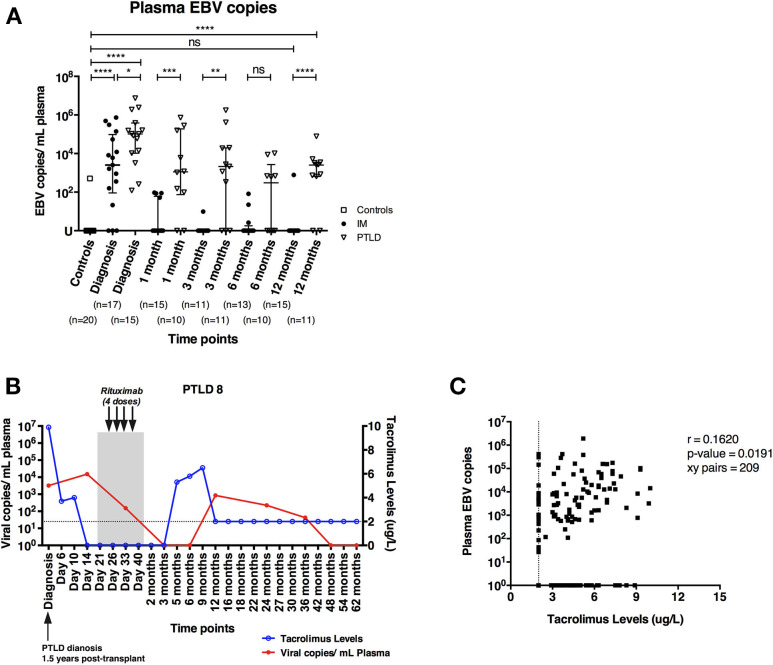
Figure 1.
PTLD patients exhibit persistently elevated plasma EBV DNA levels up to 12 months after diagnosis and plasma EBV DNA levels show weak correlation with blood tacrolimus levels. (A) Plasma EBV DNA levels in IM patients and PTLD patients were assessed at diagnosis, as well as during recovery at 1, 3, 6, and 12 months post-diagnosis. Twenty healthy adults were used as healthy controls for detecting baseline EBV DNA levels. (B) Kinetics of plasma EBV DNA levels and blood tacrolimus levels in 1 representative PTLD patient is plotted from diagnosis (D0) to longitudinal time points. Blood tacrolimus levels ≤2 μg/L were not detectable and are plotted on the dotted line depicting the detection limit. The date of PTLD diagnosis, the period and treatment of each PTLD patient (gray area) are also plotted. The plasma EBV DNA levels (red line) are plotted on left y-axis, while the blood tacrolimus levels (blue line) are plotted on right y-axis. (C) Relationship between plasma EBV DNA levels and the blood tacrolimus levels in 13 PTLD patients at various time points ranging from diagnosis to their latest follow-up time points. Two patients were excluded due to the lack of measurable pairs of tacrolimus levels and plasma EBV DNA levels for the analysis. EBV DNA levels were quantified by qPCR and reported as EBV copy numbers per ml plasma. Median ± interquartile range is shown. Mann-Whitney tests were applied to compare the plasma EBV DNA levels in different cohorts of patients at all time points. Two-tailed spearman test was applied to calculate the correlation between plasma EBV DNA levels and blood tacrolimus in PTLD patients. U, undetectable level; dotted line, limit of detection of tacrolimus in blood; ns, p > 0.05; *p ≤ 0.05; **p ≤ 0.01; ***p ≤ 0.001; and ****p ≤ 0.0001.

