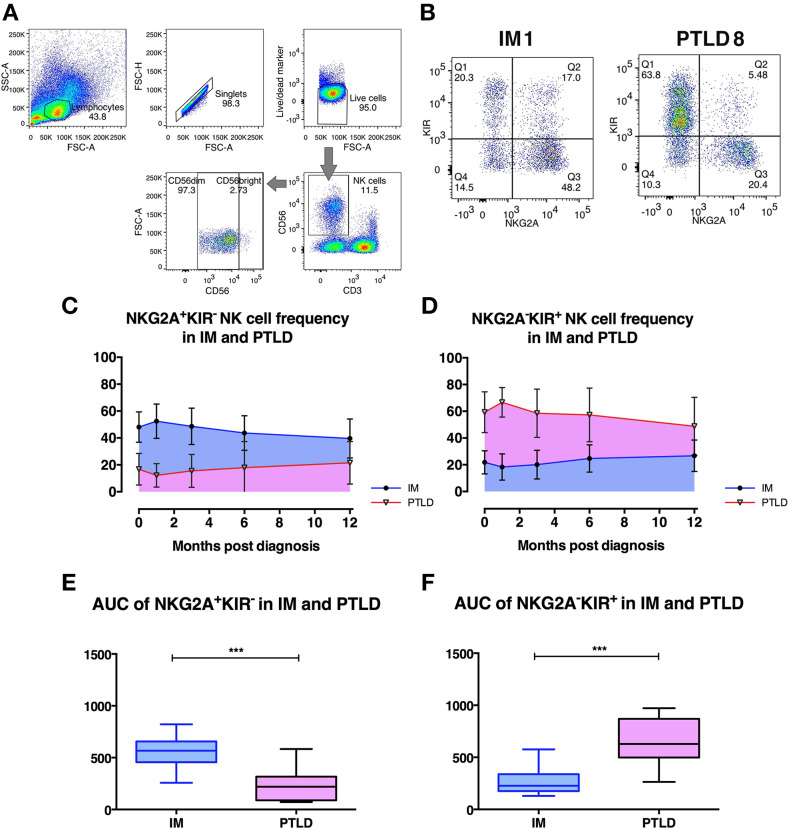
Figure 2.
The frequency of CD56dim NKG2A+KIR− NK cells is significantly higher in IM than in PTLD patients. (A) Gating strategy for flow cytometric analysis of CD56+ NK cells in 1 representative PTLD patient at diagnosis. (B) Gating strategy for flow cytometric analysis of CD56dimNKG2A−KIR+ and CD56dimNKG2A−KIR+ NK cell subsets in representative IM and PTLD patients. (C, D) The mean ± SD showing (C) CD56dimNKG2A+KIR− NK cell frequency over time and (D) CD56dimNKG2A−KIR+ NK cell frequency over time in 15 IM and 13 PTLD patients from diagnosis to 12 months post-diagnosis time point. (E) Median ± interquartile range and minimum and maximum values of area-under-the-curve (AUC) of CD56dimNKG2A+KIR− NK cell frequency vs. time (from C) and (F) CD56dimNKG2A−KIR+ NK cell frequency vs. time (from D) between IM and PTLD patients compared via Mann-Whitney tests. ***p ≤ 0.001. Blue line, IM patients; Pink line, PTLD patients.

