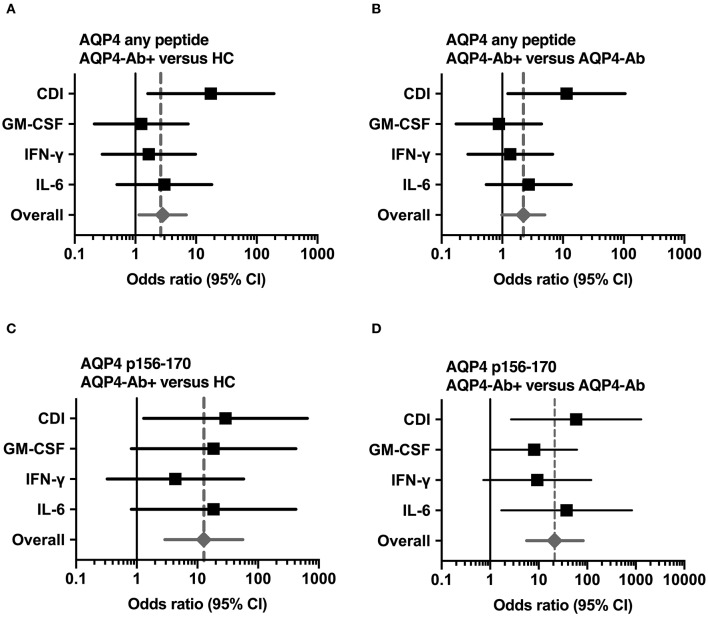
Figure 5.
Significant CD4+ T-cell reactivity to AQP4 peptides. Forest plot displaying Mantel-Haenszel common odds ratio estimates (symbols) with asymptomatic 95% CI (horizontal lines) for response to AQP4 peptides. (A) Reactivity against at least one AQP4 peptide, comparison of patients with AQP4-Ab (n = 8) vs. HC (n = 14). (B) Reactivity against at least one AQP4 peptide, comparison of patients with AQP4-Ab (n = 8) vs. all AQP4-Ab negative participants (n = 29). (C) Reactivity against AQP4 p156-170, comparison of patients with AQP4-Ab (n = 8) vs. HC (n = 14). (D) Reactivity against AQP4 p156-170, comparison of patients with AQP4-Ab (n = 8) vs. all AQP4-Ab negative participants (n = 29). AQP4-Ab+, aquaporin-4 antibody positive; AQP4-Ab-, aquaporin-4 antibody negative, CDI, cell division index; CI, confidence interval; GM-CSF, granulocyte-macrophage-colony-stimulating factor; HC, healthy controls; IFN, interferon; IL, interleukin.

