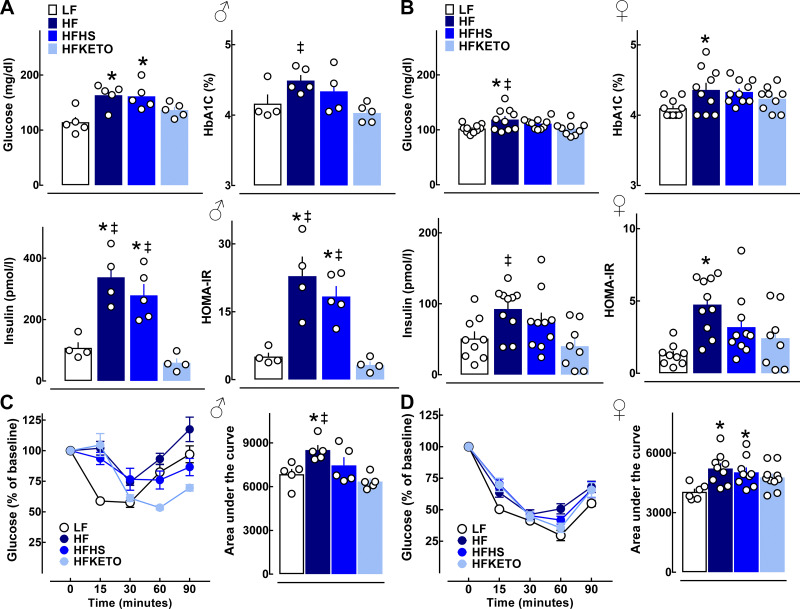
Fig. 3.
Dietary carbohydrates modulate blood metabolic parameters and insulin sensitivity in response to high-fat diets. A and B: fasted blood glucose, HbA1c, plasma insulin, and a corresponding index of insulin resistance (HOMA-IR) in male and female mice exposed for 12 wk to low-fat control (LF); high-fat (HF); high-fat, high-sugar (HFHS); or high-fat ketogenic (HFKETO) diets. C and D: insulin tolerance test with corresponding area under the curve after insulin bolus in male and female mice exposed to LF, HF, HFHS, or HFKETO diets. Values are means ± SE (n = 4–10 per group). *P < 0.05 denotes statistical significance vs. LF and ‡P < 0.05 denotes significance vs. HFKETO.

