Fig. 3.
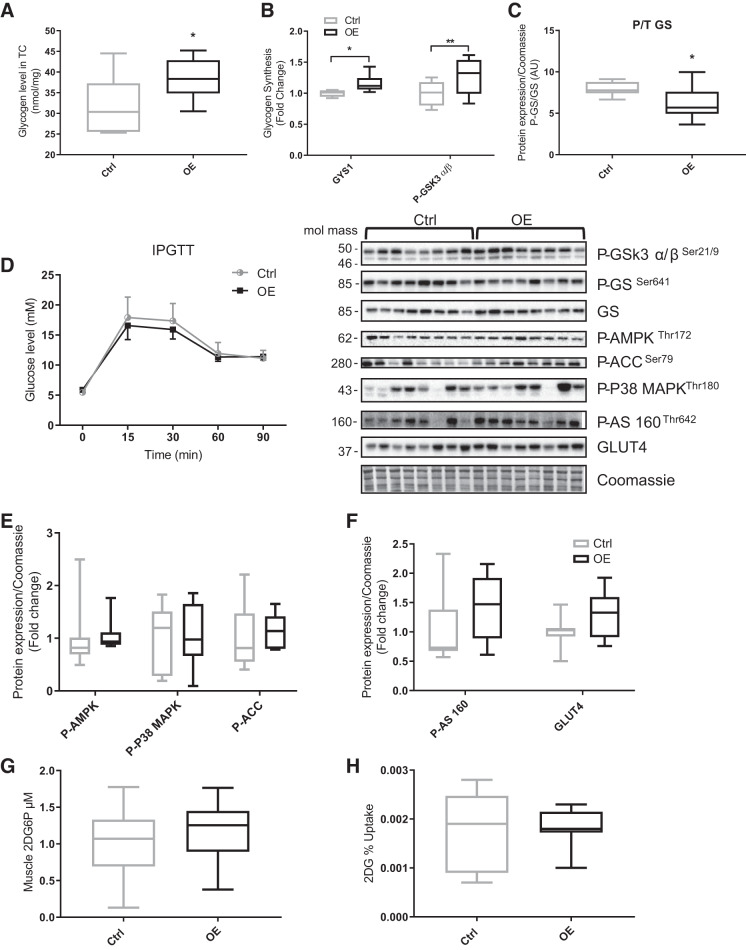
Glycogen content and glucose uptake in control (Ctrl; n = 8) and fibronectin type III domain-containing 5 overexpression (OE; n = 8) animals. A: tibialis cranialis (TC) muscle glycogen content (P = 0.04). B: glycogen synthase 1 (GYS1) gene expression (P = 0.03) and phosphorylated glycogen synthase kinase-3α/β (P-GSK3 α/β) Ser21/9 protein (P = 0.007). C: glycogen synthase (GS) activation (i.e., P-GS divided by GS protein expression; P = 0.048). D: intraperitoneal glucose tolerance test (IPGTT). E: phosphorylated 5-AMP-activated protein kinase (P-AMPK) Thr172, P-P38 MAPK Thr180, and P-acetyl-CoA carboxylase (P-ACC) Ser79. F: P-AS160 Thr642 and glucose transporter 4 (GLUT4) protein expression. G: TC muscle 2-deoxy-d-glucose-6-phosphate (2DG6P). H: 2-deoxy-d-glucose (2DG) fractional uptake (i.e., 2DG6P divided by area under the curve of 2DG plasma). Values are means ± SD. Statistical analysis was via unpaired t test. *P < 0.05, **P < 0.01 vs. Ctrl. Molecular mass is in kilodaltons. AU, arbitrary units; T, total.

