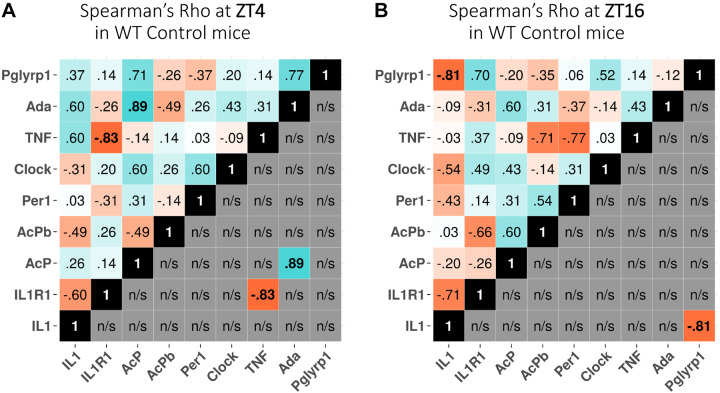
Fig. 3.
Time of day dependence of Spearman’s ρ expression correlations at zeitgeber time (ZT)4 (A) and ZT16 (B) in wild-type (WT) mice. The values shown at top left of each analysis box are the correlation values between any 2 genes. The values shown below and to the right of the black boxes show only significant expression correlations between 2 genes where their rows and columns intersect. Blue indicates positive correlations, and red shows negative correlations. n/s, Not significant.

