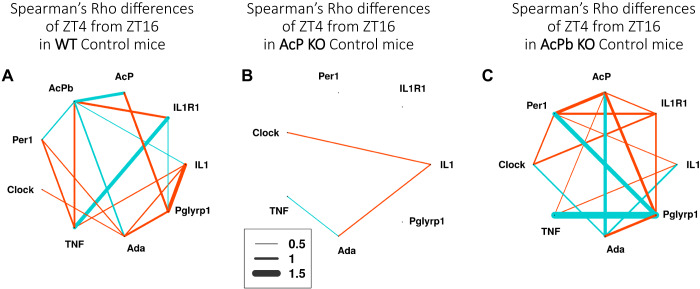
Fig. 4.
Spearman’s ρ gene expression correlation differences between zeitgeber time (ZT)4 control and ZT16 control for wild-type (WT) (A), AcP knockout (KO) (B), and AcPb KO (C) mice. The values shown represent correlation differences above 0.5 and below −0.5 after subtraction of ZT4 values from ZT16 values; e.g., compare WT AcPb and TNF mRNA expression correlation values [(−0.71) − (+0.14) = −0.57] shown in Fig. 3. Correlation differences between −0.5 and 0.5 are not shown. Line thickness indicates the strength of the correlation differences (key). Blue lines show positive correlation differences, and red lines show negative correlation differences (ZT16 – ZT4). The correlation network complexity is substantially less in the absence of AcP + AcPb as occurs in AcP KO mice (B).

