Fig. 7.
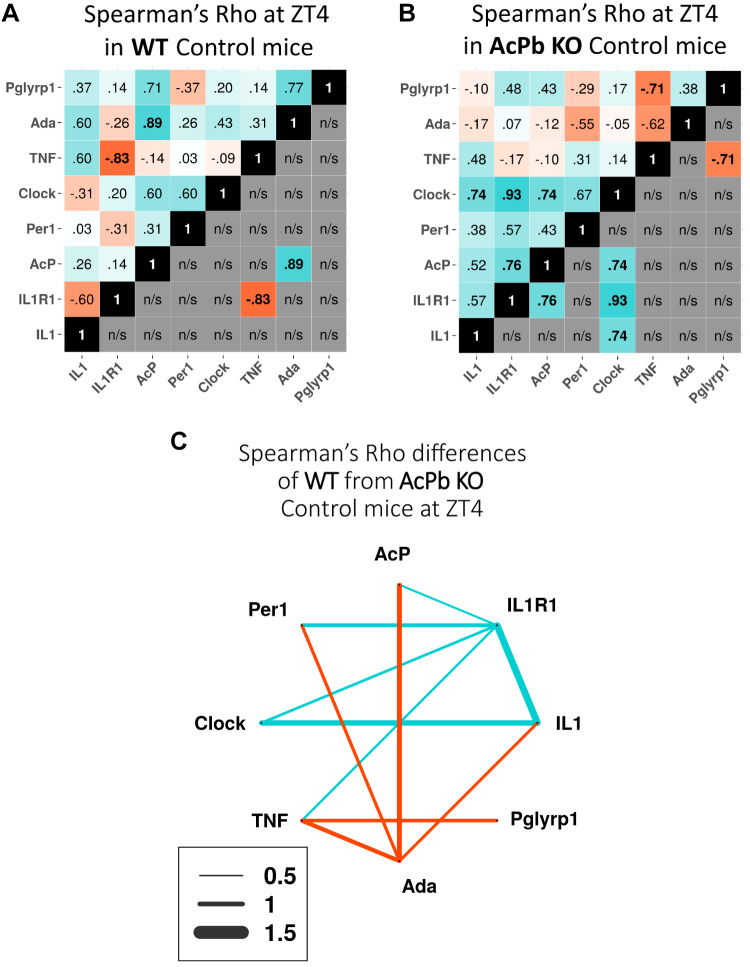
Spearman’s ρ gene expression correlations between wild-type (WT) and AcPb knockout (KO) mice under control conditions at zeitgeber time (ZT)4. A: expression correlation values between gene pairs in control WT mice at ZT4. B: correlations between gene pairs in control AcPb KO mice at ZT4. A and B: values at top left are all correlations, and values at bottom right are only those values that are statistically significant. Blue indicates positive correlation pairs, and red indicates negative correlation pairs. C: gene correlation expression differences between AcPb KO and WT at ZT4; values are expressed as the thickness of the lines and represent AcPb KO − WT. Blue indicates positive and red indicates negative values after subtractions for each gene pair were made. Difference values between −0.5 and 0.5 are not shown. n/s, Not significant.

