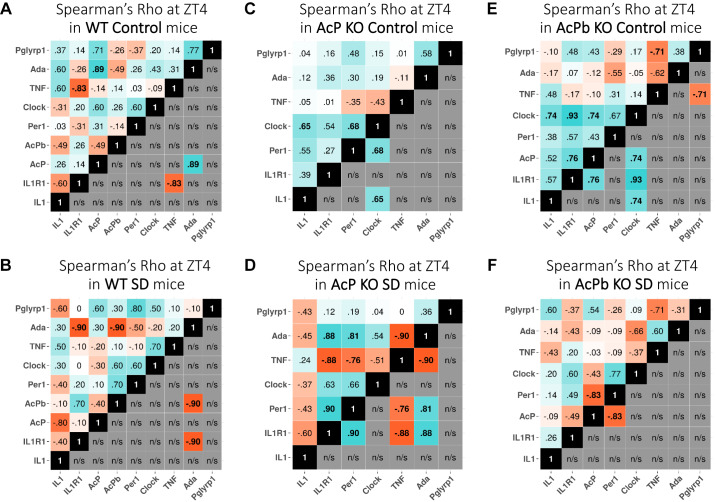
Fig. 8.
Correlation of gene expression: pairwise comparisons in control (A, C, and E) and after sleep deprivation (SD) (B, D, and F) at zeitgeber time (ZT)4 in wild-type (WT) (A and B), AcP knockout (KO) (C and D), and AcPb KO (E and F) mice. Values at top left of each analysis are expression correlation values between gene pairs, and values at bottom right are only the significant expression correlation values. Blue indicates positive correlation pairs, and red indicates negative correlation pairs. AcP and AcPb are absent in AcP KO mice, and only AcPb is absent in AcPb KO mice; thus the numbers of gene pair correlations are less for these strains. n/s, Not significant.

