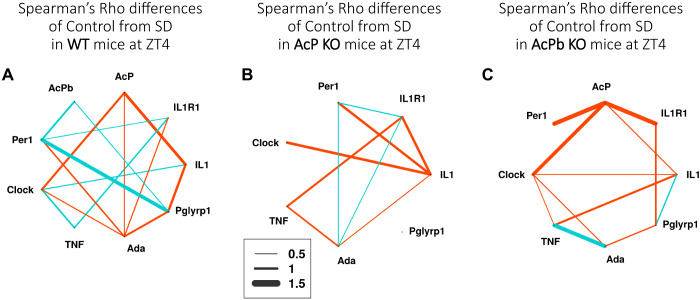
Fig. 9.
Correlation difference networks after sleep deprivation (SD) ending at zeitgeber time (ZT)4 in wild-type (WT) (A), AcP knockout (KO) (B), and AcPb KO (C) mice. Correlation differences for each strain are differences of values obtained from SD mice and from same-strain control mice. The strengths in the relationship of each difference correlation gene pair values are shown by the thickness of the lines. Blue indicate positive and red negative values after SD within-strain subtractions for each gene pair (SD – control) were made. Difference values between −0.5 and 0.5 are not shown.

