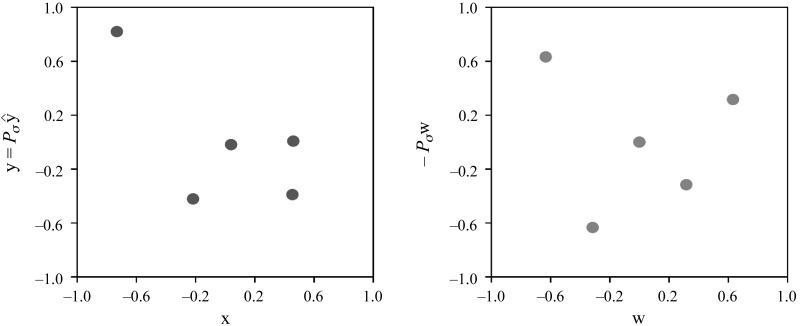
Fig. 12.
AcPb (x-axes) against IL1 (y-axes) at zeitgeber time 4 in wild-type sleep deprivation mice. The left scatterplot shows the corresponding data vectors x and y = Pσ^y, centered and scaled to have the mean of 0 and the norm of 1. The right scatterplot shows their respective ranks w and y = −Pσw, centered and scaled analogously.

