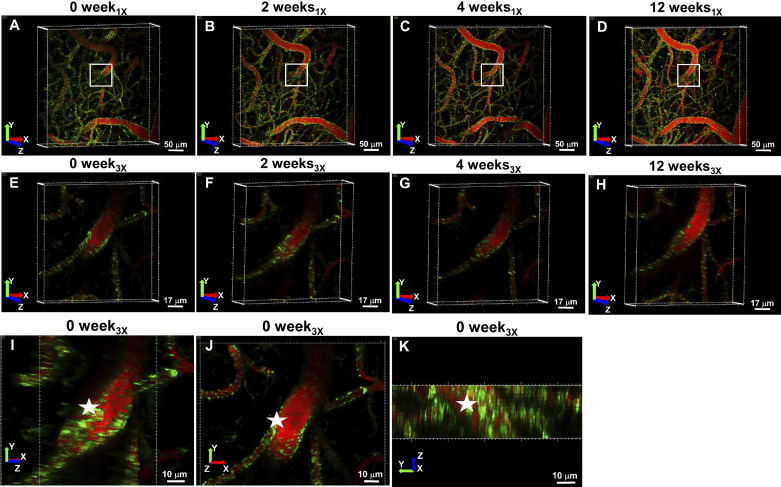
Fig. 4.
In vivo visualization of mitochondria and the cerebral vasculature over time. Green color indicates mito-Dendra2 signal, whereas red labels, the vasculature. Imaging sessions are represented by the heading above images. Colored arrows indicate the X (red), Y (green), and Z (blue) directions. A–D: 0-wk1× (A), 2-wk1× (B), 4-wk1× (C), and 12-wk1× (D) images represent projected images of 200-μm deep stacks, taken at 40× magnification with 1× digital zoom, with a scale bar indicating 50 μm. White boxes denote the area that was imaged at 40× magnification with 3× digital zoom: 0-wk3× (E), 2-wk3× (F), 4-wk3× (G), and 12-wk3× (H) images show projection of 30-μm deep 3× stacks with a scale bar indicating 17 μm. I–K: 3-dimensional reconstructed mitochondria of image 0 wk3× (30 μm deep) from a side angle, in XY plane and in YZ perspective, respectively, with a sale bar indicating 10 μm.

