Fig. 5.
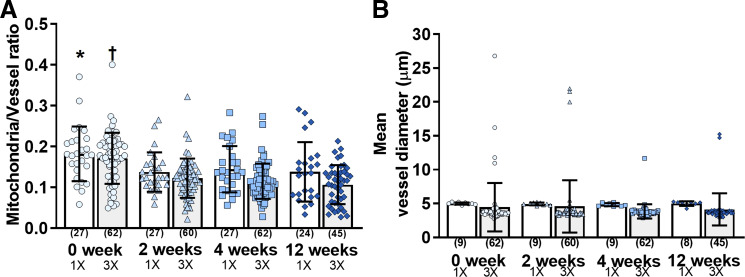
Quantification of mitochondrial and vascular signal. A: mitochondrial and vessel area ratios were similar among groups throughout the 4 consecutive imaging sessions using 1× (0 wk1×, 2 wk1×, 4 wk1×, and 12 wk1×) and 3× (0 wk3×, 2 wk3×, 4 wk3×, and 12 wk3×) digital zoom, except for 0 wk1x vs. 12 wk1x (*P < 0.05) and 0 wk3x vs. 2–12 wk3x (†P < 0.05). B: mean vessel diameter was similar among groups. Data were expressed as means (SD), and numbers in parenthesis indicate quantified areas.

