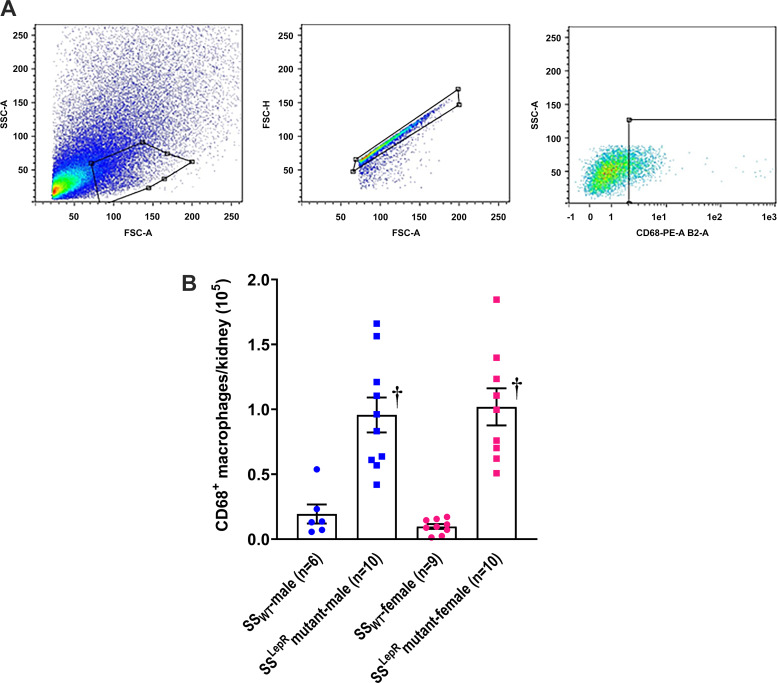
Fig. 1.
Measurement of renal macrophage infiltration. A and B: flow cytometry gating strategy (A) and sex differences in renal macrophage infiltration (B) in wild-type Dahl salt-sensitive (SSWT) rats and obese Dahl salt-sensitive leptin receptor mutant (SSLepRmutant) rats at 8 wk of age. Numbers in parentheses indicate the number of rats studied per group. Values are means ± SE. The significance of difference in mean values for a single time point was determined by one-way ANOVA followed by a Tukey’s multiple-comparisons test. P values of <0.05 were considered significantly different. †Significant difference from the corresponding value in SSWT rats within the same sex. SSC, side scatter; FSC, forward scatter; PE, phycoerythrin.

