Fig. 1.
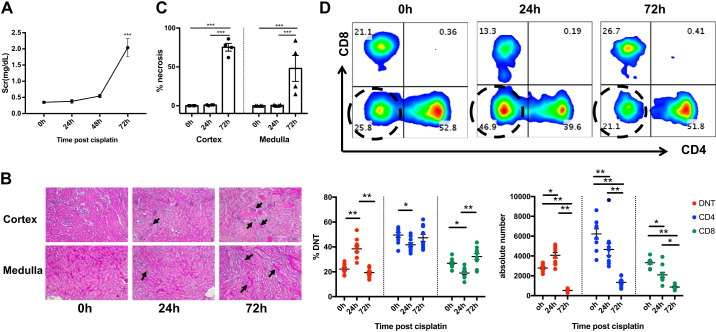
Cisplatin treatment results in a significant expansion of kidney double negative (DN) T cell population. A: cisplatin (30 mg/kg) treatment resulted in a significant increase in serum creatinine (SCr) at 72 h. B: representative kidney sections stained with hematoxylin and eosin showing extensive renal tubular necrosis in the cortex and medulla 72 h after cisplatin treatment. Arrows indicate glomeruli per high-power field in the cortex (top) and injured tubules in medullary regions (bottom). C: graph showing the cumulative percentage of necrotic tubules in each group. D: flow cytometric analysis (top) of kidney mononuclear cells at the indicated time points after cisplatin treatment showing significant DN T cell expansion, both in frequency (bottom left graph; %DNT) and absolute numbers (bottom right graph) at 24 h, followed by a decline at 72 h. Data are presented as means ± SE from at least 5 independent experiments (n = 5 mice). *P < 0.05; **P < 0.01; ***P < 0.001.

