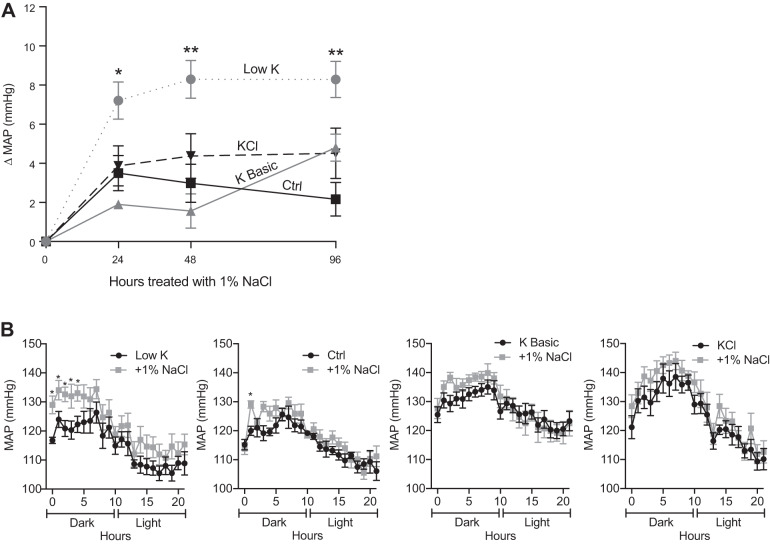
Fig. 2.
Low-K+ diet induces salt sensitivity. A: mice were treated with various K+ diets as indicated for 10 days and then challenged with 1% NaCl (supplemented to drinking water) for 96 h. The graph shows the change in mean arterial pressure (MAP; means ± SE). Mice on the low-K+ diet developed a significant change in MAP compared with the control (Ctrl) diet, whereas mice fed high-K+ basic or KCl diets had no significant change compared with the control diet (two-way ANOVA with Dunnett’s post hoc analysis, *P ≤ 0.05 and **P ≤ 0.01). n = 6 mice per diet. B: graph of the 22-h diurnal pattern showing MAP after 10 days on K+ diets and after 24 h of saline challenge. Mice maintained on the low-K+ diet had a significant elevation in MAP during the dark/active phase in response to saline challenge; however, there was no significant elevation during the light/resting phase (multiple t tests, *P ≤ 0.05). n = 6 mice per diet.

